Technical Analysis: The Complete Guide for Active Traders
⚡ Key Takeaways
- Technical analysis is the study of historical price and volume data to forecast future market movements, based on the principle that price action reflects all known information and tends to move in recognizable, repeatable patterns.
- The three core pillars of technical analysis are chart analysis (reading price movement), indicator analysis (mathematical tools derived from price/volume), and pattern recognition (identifying formations that predict future moves).
- Technical analysis works because it captures the collective psychology of millions of market participants — fear, greed, optimism, and panic manifest as identifiable patterns on charts.
- Unlike fundamental analysis which asks "what should this stock be worth?", technical analysis asks "where is the price likely to go next?" — making it especially valuable for timing entries and exits.
- Combining multiple forms of technical evidence (price patterns, indicators, volume, support/resistance) through confluence produces the highest-probability trading setups.
What Is Technical Analysis?
Technical analysis is a method of evaluating securities by analyzing data generated by market activity — primarily price and volume. Rather than examining a company's financial statements or competitive position (which is fundamental analysis), technical analysis focuses entirely on what the market itself is telling you through the price chart.
The core premise is deceptively simple: everything that can be known about a security — its earnings, its management quality, its competitive threats, the macroeconomic environment — is already reflected in the price. If that is true, then studying price behavior directly is the most efficient way to analyze a security. You do not need to be an accountant, an industry expert, or an economist. You need to be a skilled reader of price action.
Technical analysis has been practiced in some form for over 300 years. Japanese rice traders used candlestick charting in the 1700s. Charles Dow developed the Dow Theory in the late 1800s. Today, technical analysis is used by individual day traders, hedge funds managing billions of dollars, and everything in between. The tools have evolved from hand-drawn charts to sophisticated algorithmic systems, but the underlying principles — trend, support, resistance, momentum, and volume — remain unchanged.
This guide serves as a comprehensive overview of technical analysis, connecting you to detailed resources across our library for deeper study of each topic.
The Three Foundational Principles
1. Price Discounts Everything
Every piece of information — public and private, fundamental and speculative, rational and emotional — is processed by market participants and expressed through their buying and selling decisions. The resulting price reflects the collective assessment of all known information.
This does not mean the market is always "right" about a stock's value. It means that the current price represents the equilibrium between all buyers and sellers at this moment. Technical analysis studies how that equilibrium shifts over time.
2. Price Moves in Trends
Markets do not move randomly. They tend to move in trends — sustained directional movements that persist until something changes the underlying supply-demand balance. Uptrends are characterized by higher highs and higher lows. Downtrends show lower highs and lower lows.
The concept of trend is so foundational that the most famous axiom in trading is: "The trend is your friend." Most successful technical strategies are built around identifying the trend early and trading in its direction until evidence suggests it has ended.
3. History Tends to Repeat
Market participants react to similar situations in similar ways. Fear of losses produces panic selling. Greed produces euphoric buying. These emotional patterns create recognizable chart formations that repeat across different securities, timeframes, and eras.
A head and shoulders pattern on a 2024 stock chart follows the same psychological sequence as one on a 1985 chart — initial enthusiasm (left shoulder), peak euphoria (head), failed recovery attempt (right shoulder), and capitulation (neckline break). The specific prices and dates change, but the human behavior driving the pattern does not.
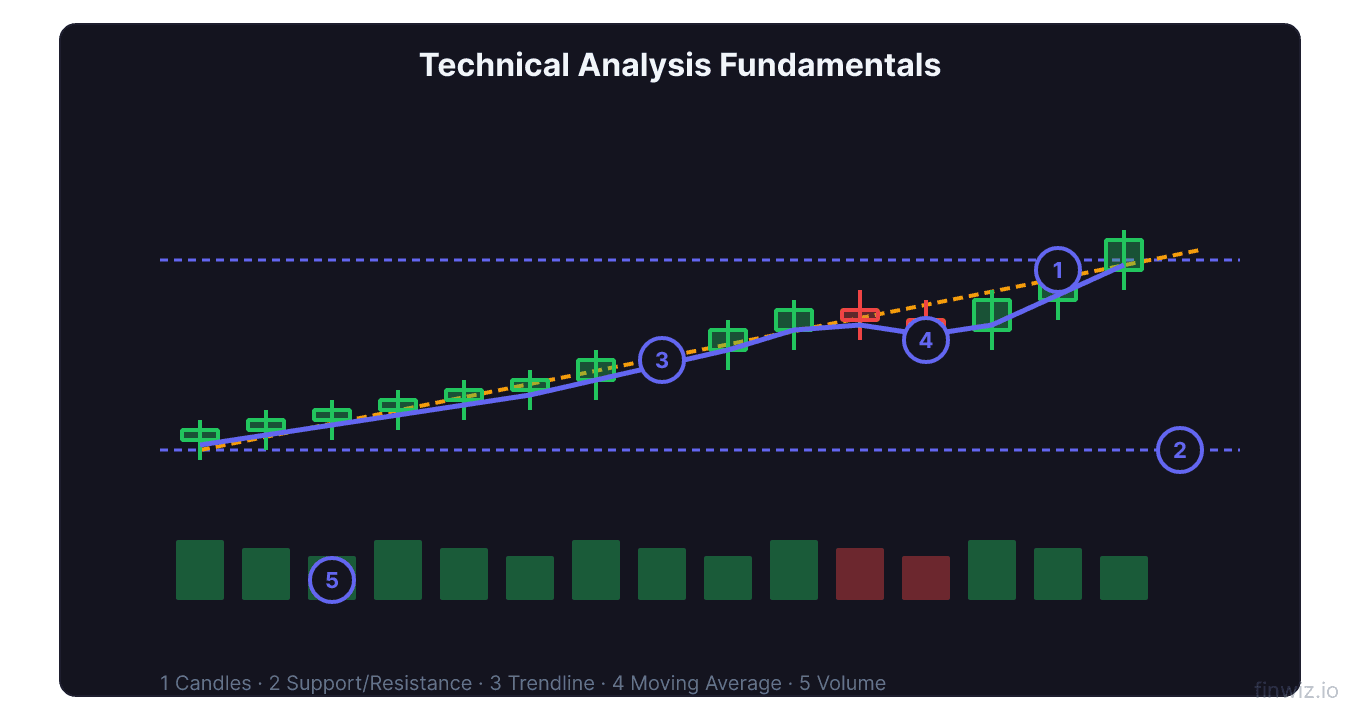
Chart Types: How We Visualize Price
The chart is the technical analyst's primary tool. Different chart types present the same price data in different ways, each with unique strengths.
Candlestick Charts
Candlestick charts are the most popular chart type among active traders. Each candle shows four data points — open, high, low, and close — for a specific time period. The "body" of the candle represents the range between the open and close, while the "wicks" (or shadows) show the high and low.
Candlesticks are powerful because they reveal the intraday battle between buyers and sellers. A long lower wick, for example, shows that sellers pushed the price down significantly during the period but buyers fought back and closed near the high — a hammer candlestick that suggests bullish reversal potential.
Our complete guide to reading candlesticks covers the mechanics in detail.
Alternative Chart Types
Beyond standard candlesticks, technical analysts use several specialized chart types:
- Renko charts: Form bricks based on price movement, ignoring time entirely. Excellent for trend identification and noise reduction.
- Point and Figure charts: Use Xs and Os in columns to track price direction. Provide objective buy/sell signals and built-in price targets.
- Tick charts: Form bars based on transaction count rather than time. Favored by day traders and scalpers for activity-based analysis.
- Heikin-Ashi charts: Modified candlesticks that use averaged values to smooth price action and make trends easier to identify.
Each chart type offers a different lens for viewing the same price data. Many traders use multiple chart types and timeframes simultaneously to build a comprehensive picture.
Chart Patterns: The Language of Price
Chart patterns are specific price formations that have historically preceded predictable price movements. They are the visual vocabulary of technical analysis — recognizable shapes that encode the collective psychology of market participants.
Reversal Patterns
Reversal patterns signal that the current trend is ending and a new trend in the opposite direction is beginning:
- Head and Shoulders: The most reliable reversal pattern, consisting of three peaks with the middle peak (head) being the highest. Its inverse (inverse head and shoulders) signals bullish reversals.
- Double Top and Double Bottom: Price tests a level twice and fails both times, indicating exhaustion. Triple tops and triple bottoms add a third test for stronger confirmation.
- Rounding Bottom: A gradual U-shaped transition from downtrend to uptrend, reflecting a slow shift in sentiment over weeks or months.
- Morning Star and Evening Star: Three-candle reversal patterns that appear at trend extremes.
Continuation Patterns
Continuation patterns represent brief pauses within existing trends before the trend resumes:
- Bull Flag: A sharp rally (the flagpole) followed by a slight downward drift (the flag), resolving with a breakout continuation higher.
- Pennant: Similar to a flag but with converging trendlines forming a small symmetrical triangle.
- Ascending Triangle: Flat resistance with rising support, typically breaking out upward.
- Descending Triangle: Flat support with declining resistance, typically breaking down.
- Symmetrical Triangle: Converging trendlines that can break either direction but usually continue the prior trend.
- Rising and Falling Wedges: Converging trendlines that slope in the same direction, typically resolving opposite to the wedge direction.
Candlestick Patterns
Individual and multi-candle formations provide granular reversal and continuation signals:
- Doji: Indecision candle where open and close are nearly equal
- Engulfing patterns: A large candle that completely engulfs the previous candle's body
- Hammer and Shooting Star: Single-candle reversal patterns
- Hanging Man: Bearish reversal at tops (same shape as hammer but different context)
- Harami: Inside bar pattern indicating consolidation
- Three White Soldiers / Three Black Crows: Three consecutive strong candles confirming trend momentum
- ABCD pattern: Harmonic pattern based on Fibonacci relationships
Our complete candlestick patterns guide and harmonic patterns guide provide exhaustive coverage of these formations.
Trap Patterns
Not all breakouts are genuine. Trap patterns catch traders on the wrong side:
- Bull Traps: False breakouts above resistance that reverse sharply, trapping buyers
- Bear Traps: False breakdowns below support that reverse sharply, trapping short sellers
Recognizing traps is as important as recognizing genuine breakouts — they are among the most costly patterns for unprepared traders.
Technical Indicators: Mathematical Tools for Analysis
Technical indicators are mathematical calculations applied to price and volume data that generate trading signals. They range from simple moving averages to complex oscillators.
Trend-Following Indicators
These indicators identify and confirm the direction of the prevailing trend:
- Moving Averages: The foundation of trend analysis. The 50-day and 200-day simple moving averages define medium and long-term trends. "Golden crosses" (50 crossing above 200) and "death crosses" (50 crossing below 200) are widely watched signals.
- MACD (Moving Average Convergence Divergence): Measures the relationship between two exponential moving averages. MACD crossovers and divergences provide trend and momentum signals.
- Parabolic SAR: Plots dots above or below price to indicate trend direction and provide trailing stop levels.
- ADX (Average Directional Index): Measures trend strength (not direction) on a scale of 0-100. ADX above 25 indicates a strong trend; below 20 indicates a range-bound market.
- Ichimoku Cloud: A comprehensive system that simultaneously shows trend direction, support/resistance, and momentum.
- Aroon Indicator: Identifies trend changes by measuring the time since the most recent high and low.
Momentum Oscillators
Oscillators measure the speed and magnitude of price changes, typically on a bounded scale. They excel at identifying overbought and oversold conditions:
- RSI (Relative Strength Index): The most popular oscillator, measuring momentum on a 0-100 scale. RSI above 70 is overbought; below 30 is oversold.
- Stochastic Oscillator: Compares the closing price to the price range over a set period. More sensitive than RSI for short-term signals.
- Williams %R: An inverted stochastic oscillator that measures overbought/oversold conditions.
- Money Flow Index (MFI): RSI-like calculation that incorporates volume — sometimes called the "volume-weighted RSI."
Volatility Indicators
These measure the degree of price variation, helping traders set stops, position sizes, and identify potential breakout conditions:
- Bollinger Bands: A moving average with upper and lower bands at 2 standard deviations. Band squeezes precede breakouts; band bounces signal mean reversion opportunities.
- ATR (Average True Range): Measures average price range per period. Essential for position sizing and stop-loss placement.
- Keltner Channels: Similar to Bollinger Bands but based on ATR instead of standard deviation, producing smoother boundaries.
- Donchian Channels: Plots the highest high and lowest low over a set period. Used in trend-following breakout systems.
Volume Indicators
Volume confirms price moves and reveals the strength of participation behind them:
- Volume in Stocks: The foundational resource for understanding how to interpret raw volume data.
- OBV (On-Balance Volume): Cumulative volume indicator that adds volume on up days and subtracts on down days.
- VWAP (Volume-Weighted Average Price): The benchmark for intraday institutional trading — prices above VWAP suggest bullish institutional flow, below suggests bearish.
- Accumulation/Distribution: Measures whether volume is flowing into or out of a security.
- Chaikin Money Flow: Measures buying and selling pressure over a period, combining price and volume.
- Volume Profile: Displays volume at each price level rather than over time, revealing support/resistance based on where most trading occurred.
- Force Index: Combines price movement and volume to measure the power behind each move.
- Elder Ray Index: Measures the strength of bulls and bears relative to a moving average.
Pro Tip
Support and Resistance: The Battleground Levels
Support is a price level where buying interest is strong enough to prevent further decline. Resistance is a price level where selling pressure is strong enough to prevent further advance. These levels are the most important concept in all of technical analysis because they represent the concrete prices where supply and demand dynamics shift.
How Support and Resistance Form
Support and resistance levels form because of market memory. Traders remember the prices where they bought, sold, or missed opportunities. When price returns to these levels, those memories trigger action:
- Traders who bought at support and profited will buy again at the same level
- Traders who missed the first rally at that level will buy now to avoid missing out again
- Traders who sold short at resistance and profited will short again at the same level
This collective behavior creates self-fulfilling price reactions at established levels.
Types of Support/Resistance
Support and resistance come from multiple sources:
- Horizontal levels: Previous highs, lows, and areas of congestion
- Trendlines and channels: Diagonal support and resistance lines
- Moving averages: The 50-day, 100-day, and 200-day MAs act as dynamic support/resistance
- Fibonacci retracements: The 38.2%, 50%, and 61.8% retracement levels
- Round numbers: Psychological levels like $50, $100, $200, $1,000
- Volume Profile levels: Prices where the most volume has traded historically
The Support/Resistance Flip
When support is broken, it often becomes resistance. When resistance is broken, it often becomes support. This "polarity switch" is one of the most reliable behaviors in technical analysis and forms the basis of many breakout and pullback trading strategies.
Volume: The Confirmation Tool
Volume is the number of shares (or contracts) traded during a given period. While price shows you where the market went, volume tells you how much conviction was behind the move.
Volume Principles
- Rising price + rising volume = Healthy uptrend (buyers are aggressive)
- Rising price + declining volume = Weakening uptrend (buying enthusiasm fading)
- Falling price + rising volume = Strong selling pressure (distribution)
- Falling price + declining volume = Selling exhaustion (potential bottom)
- Breakout with high volume = Genuine breakout with institutional participation
- Breakout with low volume = Suspect breakout, higher chance of failure
Volume-Based Strategies
Volume analysis integrates with virtually every other technical approach. Our VWAP trading strategy guide shows how institutional volume benchmarks create intraday trading opportunities. The volume profile indicator reveals support and resistance levels based on where the most trading has occurred historically.
Advanced Technical Analysis Methods
Price Action Trading
Price action trading strips away all indicators and focuses exclusively on raw price movement. Practitioners analyze candlestick patterns, support/resistance levels, and chart structures without any mathematical overlays. This approach emphasizes simplicity and developing an intuitive understanding of market behavior.
Wyckoff Method
The Wyckoff method is a century-old approach that analyzes price and volume to identify the phases of institutional accumulation and distribution. It identifies specific market phases — markup, distribution, markdown, and accumulation — that repeat as large institutions build and liquidate positions. Our Wyckoff method technical indicator guide provides the detailed methodology.
Market Profile
Market Profile organizes price and time data to identify value areas where the most trading activity occurs. It provides unique insights into institutional behavior and auction market dynamics that standard charting cannot reveal.
Multiple Timeframe Analysis
Chart timeframe analysis involves examining the same security across different timeframes simultaneously. The higher timeframe establishes the trend direction, and the lower timeframe provides entry timing. This top-down approach ensures that your trades align with the larger market structure.
Building a Technical Analysis Framework
Step 1: Determine the Trend
Start with the higher timeframe to identify the dominant trend. Is the stock above or below its 200-day moving average? Is the ADX above 25? Are moving averages sloping upward or downward?
Step 2: Identify Key Levels
Mark horizontal support and resistance, trendlines, Fibonacci levels, and moving average levels. These are the prices where the market is most likely to react.
Step 3: Wait for Confluence
The highest-probability trades occur when multiple technical factors align at the same point:
- Price reaches a support level
- RSI is oversold
- A bullish candlestick pattern forms
- Volume shows buying interest
This confluence of signals dramatically increases the probability of a successful trade compared to relying on any single factor.
Step 4: Manage Risk
Technical analysis provides the framework for precise risk management:
- Entry: Based on pattern completion or indicator signal
- Stop-loss: Below support (for longs) or above resistance (for shorts), sized using ATR
- Target: Based on pattern measured moves, resistance levels, or risk/reward ratios
- Position size: Based on the distance between entry and stop-loss, ensuring you risk no more than 1-2% of capital per trade
Step 5: Execute and Review
Execute the trade according to your plan using appropriate order types. After the trade closes, review it in your trading journal to identify what worked and what can be improved.
Limitations of Technical Analysis
What TA Cannot Do
- Predict fundamental surprises: No chart pattern can anticipate an unexpected earnings miss, fraud discovery, or regulatory action
- Work 100% of the time: Even the best setups fail 30-40% of the time — risk management is essential
- Replace fundamental analysis entirely: For long-term investing, understanding a company's business quality remains important
- Guarantee outcomes: Technical analysis provides probabilities, not certainties
Common Criticisms
- Self-fulfilling prophecy: Critics argue patterns only work because everyone is watching the same patterns. This is partially true and is actually one of the reasons patterns work — collective belief creates collective action.
- Hindsight bias: Patterns are easier to identify after the fact than in real time. Practice and experience reduce this gap.
- Conflicting signals: Different indicators and timeframes sometimes give contradictory signals. This is where trader skill in prioritizing and interpreting signals becomes essential.
Pro Tip
Getting Started: A Learning Path
If you are new to technical analysis, here is a recommended progression through our content:
Foundation (start here):
Intermediate: 5. Candlestick Patterns Guide 6. Bollinger Bands 7. MACD 8. Fibonacci Retracement 9. Chart Timeframes
Advanced: 10. Price Action Trading 11. Wyckoff Trading 12. Market Profile 13. Volume Profile 14. Ichimoku Cloud 15. Harmonic Patterns
Strategy application: 16. Day Trading Strategies 17. Swing Trading Strategies 18. Mean Reversion 19. Channel Trading 20. Backtesting
FAQ
Does technical analysis actually work?
Yes, but with nuance. Technical analysis provides a probabilistic framework — it increases your odds of making profitable trades but does not guarantee success on any individual trade. Academic research has found statistically significant evidence that certain patterns and indicators (particularly trend-following signals and momentum indicators) produce returns above what random chance would predict. The key is combining technical signals with proper risk management and trading psychology.
What is the best technical indicator?
There is no single best indicator. The most useful indicator depends on your trading style and market conditions. However, if forced to choose one, most professional traders would select moving averages because they clearly define trend direction (above = bullish, below = bearish) and provide dynamic support/resistance levels. Our moving averages guide covers this foundational tool in depth.
Can I use technical analysis for long-term investing?
Yes. While technical analysis is often associated with short-term trading, long-term investors use it for timing entries and exits. Buying a fundamentally strong stock when it is at a support level with bullish technical signals produces better long-term results than buying at a random time. Monthly and weekly charts provide the long-term technical perspective that investors need.
How long does it take to learn technical analysis?
The basics (reading candlestick charts, understanding support/resistance, using a few indicators) can be learned in weeks. Developing the pattern recognition skills and market intuition to trade profitably takes months to years of practice. Paper trading accelerates the learning process by providing risk-free practice.
Should I learn technical analysis or fundamental analysis first?
If your goal is active trading (day trading, swing trading), start with technical analysis — it is more directly applicable to timing trades. If your goal is long-term investing, start with fundamental analysis — understanding business quality is more important for multi-year holding periods. Ideally, learn both eventually. The strongest analysts combine fundamental analysis to identify what to trade with technical analysis to determine when to trade it.
Disclaimer
This is educational content, not financial advice. Trading involves risk, and you should consult a qualified financial advisor before making any investment decisions. Past performance does not guarantee future results.
Related Articles
12 chapters covering charts, indicators, risk management & more. Plus weekly trading insights.