Bull Trap: How to Spot & Avoid Fake Breakouts
⚡ Key Takeaways
- A bull trap is a false breakout above a resistance level that quickly reverses, trapping buyers who entered on the breakout and forcing them to sell at a loss.
- Bull traps are identified by a breakout above resistance that fails within 1-3 bars, typically accompanied by volume divergence — the breakout candle shows lower volume than prior approaches to the same resistance level.
- RSI divergence (price makes a higher high while RSI makes a lower high) at the breakout level is one of the most reliable warning signs that a breakout may be a trap rather than genuine.
- Avoiding bull traps requires discipline: wait for confirmation (a close above resistance with strong volume), do not chase the initial breakout candle, and always use a stop-loss below the broken resistance level.
- Experienced traders can profit from bull traps by entering short positions when the reversal is confirmed, targeting the prior support level with a tight stop above the trap high.
What Is a Bull Trap?
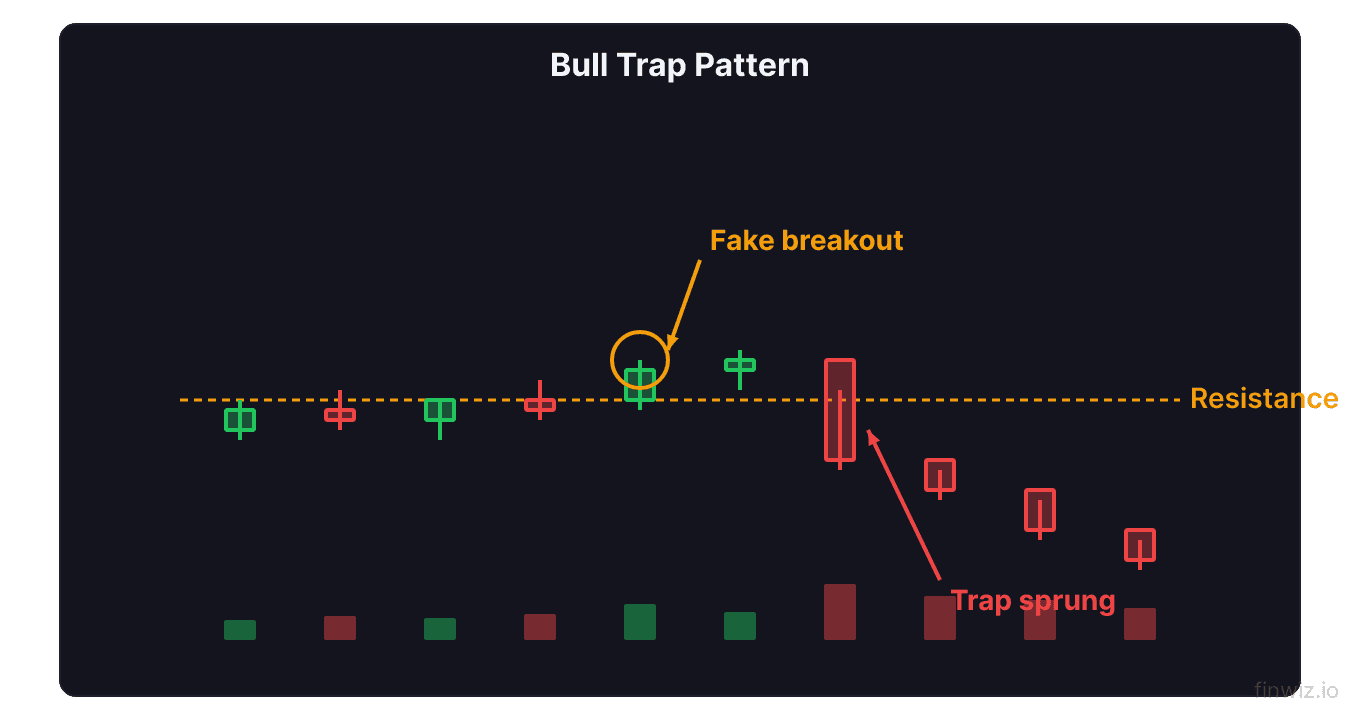
A bull trap is a deceptive market pattern where price breaks above a well-established resistance level — convincing traders that a genuine breakout is underway — only to reverse sharply back below that level. Buyers who entered on the breakout are "trapped" with losing positions as the price moves against them, often triggering a cascade of stop-loss selling that accelerates the decline.
Bull traps are one of the most frustrating experiences for technical traders. Everything looks right: the stock approaches a resistance level you have been watching, it breaks through, and you enter the trade. Then within minutes, hours, or a day or two, the breakout fails and price drops below the level, turning your profitable entry into a loss.
Understanding why bull traps occur, how to identify them before they trap you, and how to profit when they trap others is essential knowledge for anyone who trades breakout strategies. Bull traps occur on all timeframes and in all markets — from intraday charts of S&P 500 futures to weekly charts of individual stocks.
Anatomy of a Bull Trap
Stage 1: The Setup
Price approaches a clearly defined resistance level that has held multiple times. This level could be:
- A horizontal resistance zone (previous highs)
- The upper boundary of a channel or triangle
- A round psychological number ($100, $200, $1,000)
- A previous gap level
- A moving average acting as resistance (like the 200-day SMA)
Multiple touches of this resistance level create anticipation. Breakout traders place buy orders above it. The more visible the resistance, the more traders are watching and ready to act.
Stage 2: The False Breakout
Price pushes above the resistance level. Buy orders are triggered. Breakout traders enter long positions. The initial move above resistance generates excitement and FOMO — traders who were waiting on the sidelines rush in, afraid of missing the move.
The breakout candle may look convincing, with a strong close above resistance. But critical warning signs are often present for those who know where to look.
Stage 3: The Reversal
Within 1-3 bars of the breakout, price reverses sharply back below the resistance level. The reversal is often dramatic because:
- Trapped buyers panic: Long traders who entered on the breakout hit their stops or exit at market
- Short sellers enter: Traders who recognize the failed breakout initiate new short positions
- Institutional manipulation: The breakout may have been engineered by institutional traders to trigger buy orders and fill their own sell orders at higher prices (a form of liquidity hunting)
Stage 4: The Downside Continuation
After the failed breakout, price typically drops well below the resistance level — often testing the prior support level or the bottom of the recent range. The failed breakout creates a new lower high, which is a bearish technical signal that can lead to a trend change.
Bull Trap Pattern Structure:How to Identify Bull Traps Before They Happen
Warning Sign 1: Volume Divergence
The single most reliable warning sign is volume on the breakout candle. A genuine breakout should be accompanied by significantly higher volume than the previous approaches to resistance. If the breakout occurs on average or below-average volume, it lacks institutional conviction.
Compare:
- Genuine breakout: Volume on the breakout bar is 1.5-3x the 20-day average volume
- Potential bull trap: Volume on the breakout bar is equal to or less than average volume
Many traders add volume indicators like OBV to confirm breakouts. If OBV is trending upward during the breakout, the move is more likely genuine. If OBV is flat or declining while price breaks out, the volume conviction is missing.
Warning Sign 2: RSI Divergence
Bearish RSI divergence occurs when price makes a higher high (the breakout above resistance) while RSI simultaneously makes a lower high. This divergence signals that momentum is weakening even as price reaches new highs — a classic precursor to a reversal.
To check for RSI divergence:
- Note the RSI reading during the most recent approach to resistance (before the breakout)
- Note the RSI reading during the actual breakout
- If the breakout RSI is lower than the prior approach RSI while price is higher, bearish divergence is present
- This divergence significantly increases the probability that the breakout will fail
Pro Tip
Warning Sign 3: Weak Breakout Candle Structure
The shape of the breakout candle itself contains important clues:
Genuine breakout characteristics:
- Large real body (strong close well above resistance)
- Small or no upper wick (no selling pressure at the highs)
- Closes in the top 25% of its range
Bull trap warning characteristics:
- Long upper wick (selling pressure at the highs — shooting star shape)
- Small real body (indecision despite the breakout)
- Closes in the lower half of its range
- Close is only marginally above resistance
A breakout that produces a doji or a spinning top candle at the resistance level is highly suspicious and should not be traded without additional confirmation.
Warning Sign 4: Time of Day / Market Context
Bull traps occur more frequently in specific contexts:
- Late in the trading day: Breakouts that occur in the last hour of trading, especially on lighter volume, are less reliable
- Before major events: Breakouts before earnings, Fed announcements, or economic data releases are frequently reversed by the event
- In overall downtrends: Breakouts above local resistance within a broader downtrend fail more often because the dominant selling pressure reasserts itself
- At the end of a long uptrend: When a stock has already rallied significantly, a breakout to new highs is more likely to be a final push before exhaustion
How to Avoid Bull Traps
Strategy 1: Wait for Confirmation
The simplest way to avoid bull traps is to not buy the initial breakout candle. Instead, wait for:
- A second close above resistance (two consecutive daily closes above the level)
- A retest of the broken resistance level as support (price breaks out, pulls back to the resistance level, and bounces — confirming the level has flipped from resistance to support)
- A specific volume threshold (e.g., breakout volume exceeds the 20-day average by at least 50%)
This approach means you will enter at a slightly worse price on genuine breakouts, but you will avoid the majority of bull traps.
Strategy 2: Use a Tight Stop Below Resistance
If you do enter on the breakout, place your stop-loss immediately below the broken resistance level. If price drops back below resistance, the breakout has failed, and you exit with a small loss before the full decline develops.
Example:
- Resistance at $50
- Breakout entry at $51
- Stop-loss at $49.50 (below the resistance level)
- Maximum risk: $1.50/share (approximately 3%)
Strategy 3: Reduce Position Size on Initial Breakout
Enter with only half (or a third) of your intended position on the initial breakout. Add to the position only if the breakout is confirmed by a successful retest or continued upside with volume. If the breakout fails, you lose less because your position was smaller.
Strategy 4: Check Multiple Timeframes
Before trading a breakout on the daily chart, check the weekly chart. If the weekly chart shows the stock approaching long-term resistance or is heavily overbought, a daily breakout is more likely to fail. Multiple timeframe analysis filters out many false breakouts by ensuring the breakout direction aligns with the larger trend.
How to Trade the Bull Trap Reversal
Experienced traders do not just avoid bull traps — they profit from them. When a breakout fails, the resulting reversal is one of the most powerful short-selling setups in technical analysis.
The Bull Trap Short Entry
- Identify the failed breakout: Price broke above resistance but has now closed back below it
- Wait for the close below resistance: Do not short while price is still above resistance — let the failure confirm
- Enter short: On the close below the resistance level or on a lower open the next day
- Stop-loss: Above the bull trap high (the highest point of the failed breakout)
- Target: The prior support level or the bottom of the recent trading range
Why Bull Trap Reversals Are Powerful
The failed breakout creates a powerful cocktail of selling pressure:
- Trapped buyers sell to cut losses (stop-loss cascade)
- New short sellers enter (recognizing the failed breakout)
- Sidelined traders lose confidence and cancel pending buy orders
- Algorithms detect the failed breakout pattern and generate sell signals
This concentrated selling often produces rapid, outsized moves — making bull trap reversals some of the best risk/reward short setups available.
Real-World Example
Consider a stock that has tested $100 resistance three times over two months. On the fourth approach, it breaks through to $102 on moderate volume with RSI at 65 (while the previous approach to $100 saw RSI at 72 — bearish divergence). The next day, the stock gaps down and closes at $98 — back below the $100 resistance.
A trader who recognized this as a bull trap could:
- Short at $98 (confirmation of failed breakout)
- Stop-loss at $102.50 (above the trap high)
- Target at $92 (prior support level)
- Risk: $4.50 | Reward: $6.00 | R:R = 1:1.33
Bull Traps vs. Bear Traps
Bull traps and bear traps are mirror images:
| Feature | Bull Trap | Bear Trap |
|---|---|---|
| Direction | False breakout above resistance | False breakdown below support |
| Who gets trapped | Buyers (longs) | Sellers (shorts) |
| Aftermath | Price falls below resistance | Price rises above support |
| Best trade | Short the failed breakout | Buy the failed breakdown |
| Volume clue | Low volume on upside break | Low volume on downside break |
| Momentum clue | Bearish RSI divergence | Bullish RSI divergence |
Both patterns exploit the same psychological dynamic: traders act on the initial directional signal only to be caught by a reversal. The key difference is the direction of the trap and who benefits from it.
FAQ
How common are bull traps?
Bull traps are more common than most traders realize. Studies of breakout strategies consistently show that approximately 40-50% of breakouts fail within the first few days. The failure rate is even higher in range-bound markets, during low-volume periods, and in stocks that are already extended from their moving averages. This is why confirmation-based breakout strategies significantly outperform strategies that buy every initial breakout.
Can bull traps occur on intraday charts?
Yes. Bull traps are extremely common on intraday charts, particularly at the market open when premarket levels are tested. A stock that gaps above premarket resistance and then reverses within the first 30 minutes is a classic intraday bull trap. Intraday bull traps tend to be shorter in duration (reversing within minutes to hours) but follow the same volume and momentum divergence patterns as daily chart bull traps.
What is the difference between a bull trap and a pullback?
A pullback is a temporary retracement within a valid breakout — price breaks above resistance, pulls back to test the level as support, and then continues higher. A bull trap is a complete failure — price breaks above resistance but drops back below and continues declining. The key difference is whether the broken resistance level holds as support on the pullback. If it holds, it is a pullback (buying opportunity). If it fails, it is a bull trap (exit or short opportunity).
Do bull traps only happen at horizontal resistance?
No. Bull traps can occur at any type of resistance: horizontal levels, trendlines, channel boundaries, moving averages, and Fibonacci retracement levels. The psychology is the same regardless of the resistance type — buyers enter on the perceived breakout, and sellers overwhelm them, reversing the move.
How do institutional traders use bull traps?
Some institutional traders deliberately create bull traps through a process called stop hunting or liquidity sweeping. Large orders push price briefly above a visible resistance level to trigger buy orders and stops from retail traders. Once these orders are filled (providing liquidity for the institutional sell orders), the institution allows price to drop back below resistance. This is why many dark pool and institutional strategies involve fading breakouts rather than trading them.
Disclaimer
This is educational content, not financial advice. Trading involves risk, and you should consult a qualified financial advisor before making any investment decisions. Past performance does not guarantee future results.
Related Articles
12 chapters covering charts, indicators, risk management & more. Plus weekly trading insights.