How to Read Candlestick Charts: Complete Visual Tutorial
⚡ Key Takeaways
- Every candlestick displays four data points — open, high, low, and close — in a single visual unit, making price action far more readable than bar or line charts.
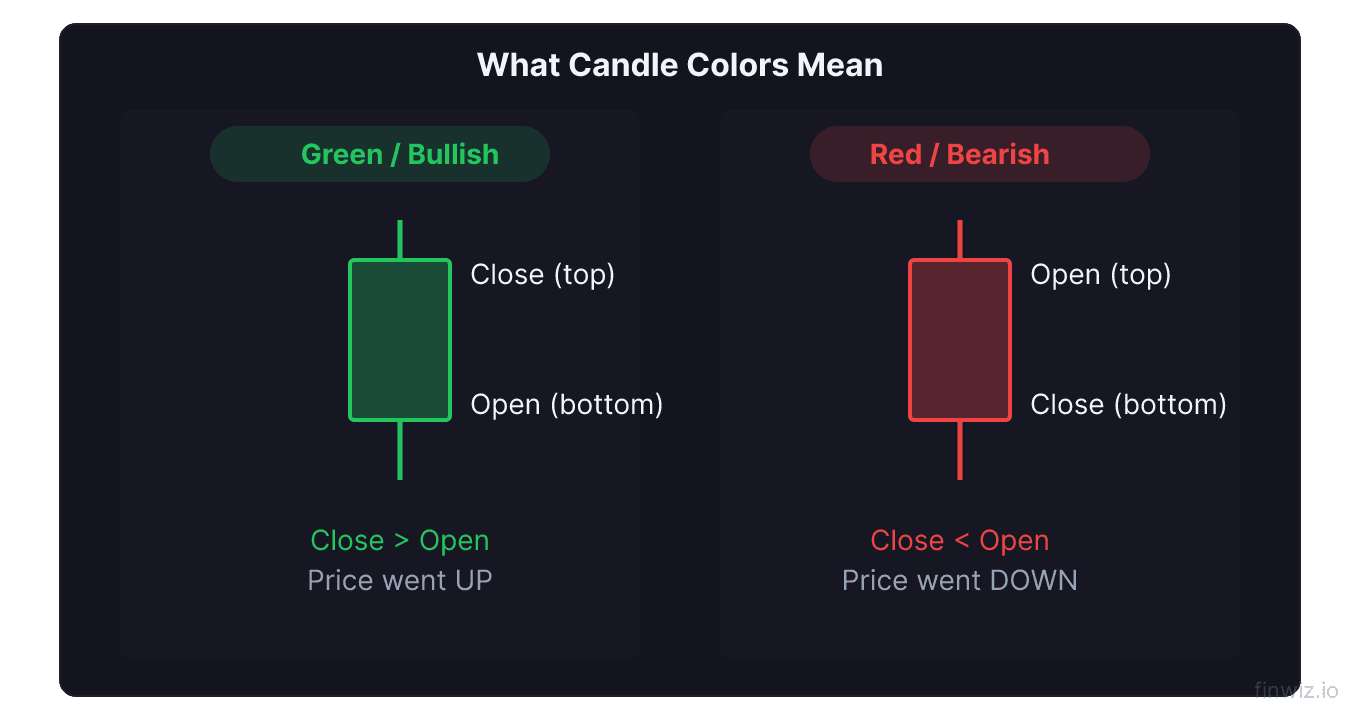
- The real body represents the range between the open and close: a green (bullish) body means the close is above the open, and a red (bearish) body means the close is below the open.
- The wicks (shadows) extend above and below the body to show the session
What Are Candlestick Charts?
Candlestick charts are the most popular method of displaying price data in financial markets. Each candle represents one time period — whether that is one minute, one hour, one day, or one month — and conveys four essential pieces of information: the open, high, low, and close prices.
Candlestick charting originated in 18th-century Japan, where rice trader Munehisa Homma developed the technique to track rice market prices. The method was introduced to Western traders in the 1990s by Steve Nison and has since become the dominant charting method worldwide.
The reason candlesticks dominate modern charting is simple: they pack more information into a single visual element than any other chart type. A line chart shows only the close. A bar chart shows all four prices but is harder to read visually. Candlesticks show all four prices and convey the relationship between buyers and sellers through color and shape.
Anatomy of a Single Candlestick
Every candlestick has up to three visible components: the real body, the upper shadow (upper wick), and the lower shadow (lower wick).
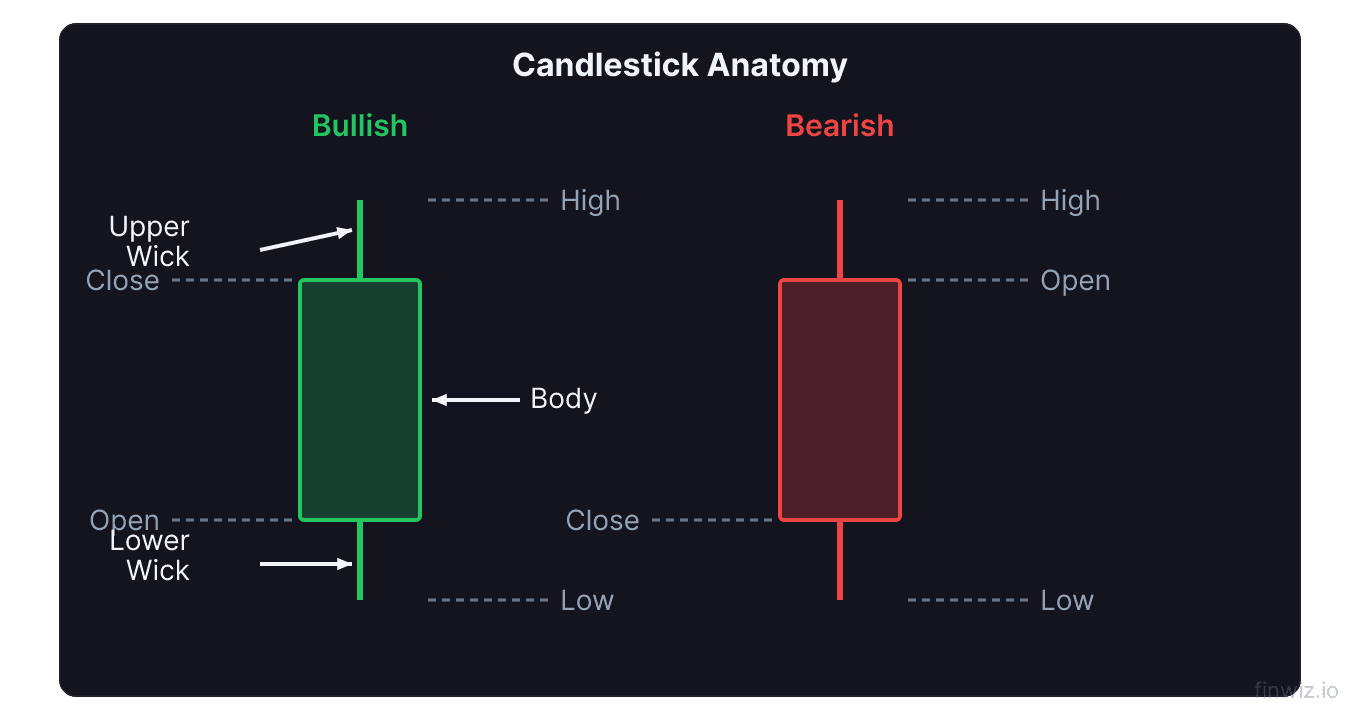
The Real Body
The real body is the thick, colored portion of the candle. It represents the distance between the open and close prices.
- Bullish candle (green/white): The close is above the open. The bottom of the body is the open price, and the top of the body is the close price. Buyers drove the price higher during the session.
- Bearish candle (red/black): The close is below the open. The top of the body is the open price, and the bottom of the body is the close price. Sellers drove the price lower during the session.
The size of the body tells you how much net price movement occurred. A large body means strong directional conviction. A small body means the open and close were near each other, indicating indecision or a standoff between buyers and sellers.
The Upper Shadow (Upper Wick)
The upper shadow is the thin line extending above the real body. It reaches from the top of the body to the session's high. The upper shadow represents the highest price reached during the session that buyers could not hold through the close.
A long upper shadow on a bullish candle means buyers pushed prices much higher but lost some ground by the close. A long upper shadow on a bearish candle means buyers attempted a rally but sellers rejected it decisively.
The Lower Shadow (Lower Wick)
The lower shadow extends from the bottom of the real body down to the session's low. It represents the lowest price sellers achieved during the session before buyers pushed the price back up.
A long lower shadow indicates that sellers drove prices lower but buyers ultimately rejected those lower prices, reclaiming most or all of the lost ground.
Pro Tip
Understanding Candlestick Colors
Candlestick colors vary by platform, but the most common color schemes are:
| Color Scheme | Bullish (Close > Open) | Bearish (Close < Open) |
|---|---|---|
| Modern default | Green | Red |
| Traditional Japanese | White (hollow) | Black (filled) |
| Alternative | Blue | Orange |
The key point is that color indicates the relationship between open and close, not whether the price moved up or down from the prior session. A candle can be green (bullish close above open) yet still close lower than the previous session's close. This distinction is important for beginners who sometimes confuse intra-session direction with inter-session direction.
You can customize candlestick colors on most charting platforms. Choose whatever color scheme is most visually clear to you, and stick with it consistently.
Reading Price Action Through Candles
Each candlestick tells a story about the session's price action. Learning to read these stories is the foundation of candlestick pattern analysis.
Large Green Candle (Bullish Marubozu)
A large green candle with minimal shadows shows overwhelming buying pressure. Buyers dominated from open to close with little resistance from sellers. When these candles appear after a downtrend, they can signal a powerful reversal.
Large Red Candle (Bearish Marubozu)
A large red candle with minimal shadows indicates overwhelming selling pressure. Sellers controlled the session from start to finish. These candles after an uptrend can be early warnings of a trend reversal.
Hammer / Hanging Man Shape
A small body at the top with a long lower shadow. In a downtrend, this is a hammer (bullish). In an uptrend, it is a hanging man (bearish). The long lower shadow shows a dramatic seller attempt that buyers rejected.
Shooting Star / Inverted Hammer Shape
A small body at the bottom with a long upper shadow. In an uptrend, this is a shooting star (bearish). In a downtrend, it is an inverted hammer (bullish). The long upper shadow shows a dramatic buyer attempt that sellers rejected.
Doji
A candle where the open and close are virtually identical, creating a cross or plus sign shape. The doji represents extreme indecision and often appears at trend turning points.
Spinning Top
A spinning top has a small body with long shadows on both sides. It signals indecision where both buyers and sellers were active but neither achieved dominance.
Timeframes and Their Significance
Candlesticks can be displayed on any timeframe. Each timeframe serves different purposes and carries different significance.
Common Timeframes
| Timeframe | Use Case | Signal Reliability | Typical Trader |
|---|---|---|---|
| 1-minute | Scalping | Low | Scalpers |
| 5-minute | Day trading | Low-Moderate | Day traders |
| 15-minute | Day trading | Moderate | Day traders |
| 1-hour | Day/swing trading | Moderate | Active traders |
| 4-hour | Swing trading | Moderate-High | Swing traders |
| Daily | Swing/position trading | High | Most traders |
| Weekly | Position trading | Very high | Position traders |
| Monthly | Investing | Highest | Long-term investors |
Why Higher Timeframes Are More Reliable
Higher timeframe candles represent more market participants, more volume, and more deliberate decision-making. A daily candle reflects the cumulative decisions of thousands of traders over an entire session. A 1-minute candle might reflect just a handful of orders.
This is why patterns on daily and weekly charts produce more reliable signals than the same patterns on 5-minute charts. When you spot a hammer on a weekly chart, it represents an entire week where sellers failed to maintain lower prices — a much more significant event than a 5-minute hammer.
Pro Tip
Building Blocks: Single-Candle Patterns
Mastering individual candle shapes prepares you for recognizing multi-candle patterns. Here are the essential single-candle formations every trader should know.
| Pattern | Body Size | Upper Shadow | Lower Shadow | Signal |
|---|---|---|---|---|
| Marubozu | Large | None | None | Strong trend |
| Hammer | Small (top) | Little/none | Long (2x+ body) | Bullish reversal |
| Shooting Star | Small (bottom) | Long (2x+ body) | Little/none | Bearish reversal |
| Doji | None (line) | Varies | Varies | Indecision |
| Spinning Top | Small (center) | Long | Long | Indecision |
| Dragonfly Doji | None (at top) | None | Long | Bullish |
| Gravestone Doji | None (at bottom) | Long | None | Bearish |
Multi-Candle Patterns: The Next Level
- Heikin Ashi Candles Once you can read individual candles, you are ready for multi-candle patterns that provide stronger, more reliable trading signals.
Two-Candle Patterns
- Engulfing pattern: A large candle completely engulfs the prior candle's body. Bullish engulfing at bottoms, bearish engulfing at tops.
- Harami: A small candle contained within the prior large candle's body. Signals momentum loss.
- Piercing line / Dark cloud cover: Candles that close significantly into the prior candle's body, signaling reversal.
Three-Candle Patterns
- Morning star / Evening star: Three-candle reversal pattern with a star (small body) in the middle.
- Three White Soldiers / Three Black Crows: Three consecutive strong candles signaling powerful reversal.
Chart Patterns
Beyond individual candlestick patterns, candles form larger chart patterns over many sessions:
- Head and shoulders — reversal pattern with three peaks
- Double top / Double bottom — two-test reversal pattern
- Triangles — continuation or breakout patterns
- Cup and handle — bullish continuation formation
Practical Tips for Reading Candlesticks
Always Read Left to Right
Context matters more than individual candles. Before analyzing any candle, scan the chart from left to right to understand:
- What is the prevailing trend?
- Are there nearby support or resistance levels?
- What has volume been doing?
- Are any indicators at extremes?
Focus on the Close
The close is the most important price in any candle because it represents the final consensus of value for that session. Where the close falls relative to the candle's range tells you who won the session:
- Close near the high = buyers won
- Close near the low = sellers won
- Close in the middle = nobody won (indecision)
Use Multiple Timeframes
Analyze at least two timeframes: a higher timeframe for trend direction and a lower timeframe for entry timing. For example, use the weekly chart to determine the trend and the daily chart to find entry signals that align with that trend.
Combine with Volume
Volume validates candlestick signals. A large bullish candle on high volume is far more significant than the same candle on thin volume. Always confirm important candles with volume analysis. Consider learning volume-based indicators early in your trading education.
Common Beginner Mistakes
Analyzing candles in isolation. A single candle means nothing without context. Always consider the surrounding trend, nearby price levels, and volume.
Ignoring shadows. Beginners often focus only on body color and size. The shadows contain equally important information about intra-session rejection and the battle between buyers and sellers.
Using too many timeframes. Start with one or two timeframes. Analyzing five or six timeframes simultaneously leads to confusion and conflicting signals.
Pattern hunting. Not every candle forms a tradeable pattern. Most candles are noise. Be patient and selective, waiting for clear patterns at significant levels.
Neglecting confirmation. Most candlestick patterns require confirmation from subsequent price action. Acting on patterns before they confirm leads to poor results.
Frequently Asked Questions
What is the best candlestick pattern for beginners?
The hammer and engulfing pattern are the best starting points for beginners. Both are visually easy to identify, have clear trading rules, and produce relatively reliable signals. Master these two patterns before expanding your repertoire.
Do candlestick patterns actually work?
Candlestick patterns provide a statistical edge, not guaranteed outcomes. Studies show that certain patterns, when properly confirmed and filtered, produce win rates of 55-65%. The edge comes from combining patterns with support/resistance, volume analysis, and indicator confirmation.
Why are candlestick charts better than line charts?
Candlestick charts show four prices per period (open, high, low, close) compared to a line chart's one (close only). This additional data reveals intra-session price action, rejection levels, and the struggle between buyers and sellers — all invisible on a line chart. However, line charts can be useful for quickly identifying trends and support/resistance levels.
How many candlestick patterns should I learn?
Focus on mastering 5 to 10 core patterns rather than memorizing all 50+. The most practical patterns include: hammer, engulfing, doji, morning/evening star, and head and shoulders. Depth of understanding beats breadth of memorization.
Can candlestick patterns be used for stocks, forex, and crypto?
Yes. Candlestick patterns work across all financial markets including stocks, forex, futures, and cryptocurrencies. The underlying principles of buyer-seller psychology are universal. However, the specific reliability of each pattern may vary by market due to differences in trading hours, liquidity, and participant behavior.
Do I need to memorize all the Japanese names?
No. While knowing names like "doji," "marubozu," and "harami" is useful for communication with other traders, understanding the visual shape and its meaning is far more important than memorizing terminology. Focus on what each candle shape tells you about buyer and seller behavior.
Disclaimer
This is educational content, not financial advice. Trading involves risk, and you should consult a qualified financial advisor before making any investment decisions. Past performance does not guarantee future results.
12 chapters covering charts, indicators, risk management & more. Plus weekly trading insights.