Shooting Star Candlestick: Bearish Reversal at Resistance
⚡ Key Takeaways
- The shooting star is a single-candle bearish reversal pattern that appears at the top of an uptrend, featuring a small body near the session low and a long upper wick.
- The long upper shadow (at least twice the body length) shows that buyers pushed prices significantly higher but sellers overwhelmed them by the close.
- The shooting star is most reliable when it forms at a resistance level, after an extended uptrend, and on above-average volume.
- Confirmation from the next candle (a bearish close below the shooting star
What Is a Shooting Star Candlestick?
The shooting star is a single-candle bearish reversal pattern that forms during or at the top of an uptrend. It is one of the most visually distinctive and widely recognized candlestick patterns in technical analysis.
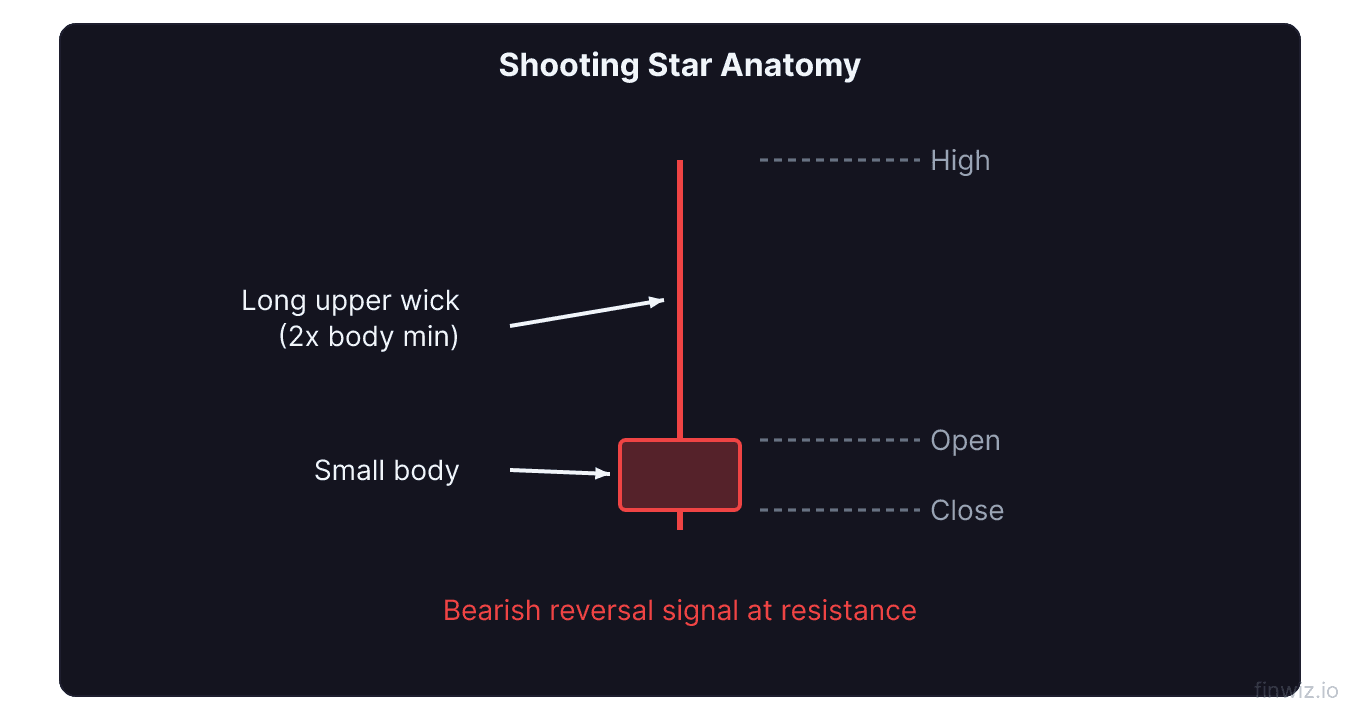
The shooting star features a small real body at the lower end of the session's trading range with a long upper shadow (wick) that extends at least twice the length of the body. There should be little to no lower shadow. The pattern resembles a shooting star falling from the sky, with the long tail trailing behind.
The psychology behind the shooting star is compelling. During the session, buyers initially pushed prices sharply higher, continuing the uptrend's momentum. However, at some point during the session, sellers entered with enough force to drive the price all the way back down to near the open. The long upper shadow represents the territory bulls claimed but could not hold, revealing that selling pressure is building at higher levels.
Anatomy of the Shooting Star
Precise identification requires understanding each structural component.
Real Body
The real body should be small and positioned near the bottom of the session's range. The body can be either bearish (red, close below open) or bullish (green, close above open). A bearish body is slightly preferred because it shows sellers pushed the close below the open, adding to the bearish narrative. However, both colors produce valid shooting stars.
Upper Shadow
The upper shadow is the defining feature of the shooting star. It must be at least twice the length of the real body. The longer the shadow, the more significant the rejection of higher prices. Shooting stars with upper shadows three to four times the body length are particularly powerful, showing that buyers pushed aggressively higher but were thoroughly rejected.
Lower Shadow
Ideally, the shooting star has no lower shadow or only a very small one. The absence of a lower shadow confirms that the close was near the session low, meaning sellers maintained their advantage through the end of the session. A noticeable lower shadow dilutes the bearish signal.
Pro Tip
Conditions for a Valid Shooting Star
Several conditions must be present for a shooting star to carry meaningful reversal implications.
Uptrend context. The shooting star must appear during an uptrend or after a meaningful advance. The same candle shape at the bottom of a downtrend is called an inverted hammer and carries bullish rather than bearish implications. Context determines the pattern's meaning.
Key level proximity. Shooting stars that form at significant resistance levels, prior swing highs, round numbers, or declining moving averages are substantially more reliable than those appearing in open space on the chart. The confluence of the pattern with a known supply zone creates a higher-probability trading opportunity.
Sufficient advance. The uptrend preceding the shooting star should be meaningful, not just a single green candle. The more extended the prior advance, the more significant the shooting star becomes as a signal that the advance is running out of energy.
How to Trade the Shooting Star
The shooting star provides a structured approach to entering bearish positions.
Waiting for Confirmation
As with all single-candle patterns, the shooting star requires confirmation from the following session. The next candle should close bearish, ideally below the shooting star's real body or below its low. Without confirmation, the shooting star remains a single-session event that may not lead to a sustained reversal.
Why confirmation matters: Sellers showed strength during the shooting star session, but they did not necessarily win the war. If the next session opens higher and rallies, the shooting star may have been a temporary pause rather than a reversal. Confirmation proves that selling pressure persists beyond the single session.
Entry Strategies
Standard entry: Sell short or exit long positions on the close of the confirmation candle (the bearish candle following the shooting star).
Below-the-low entry: Enter short when price breaks below the low of the shooting star. This provides additional confirmation that sellers are pushing through the session's support level.
Aggressive entry: Sell short at the close of the shooting star session itself, before confirmation. This approach provides the best price but the highest risk. Only use it when additional factors (strong resistance, overbought RSI, high volume) strongly support the bearish thesis.
Stop Loss
Place the stop above the high of the shooting star (the top of the upper shadow). This level represents the extreme of buying pressure during the session. If price exceeds this level, the upper shadow rejection has been overcome, and the uptrend may continue.
Price Target
Target methods include:
- Previous support: The nearest significant support level below the shooting star
- Measured move: The length of the shooting star's range (high to low) projected downward from the low
- Moving average: The 20-day or 50-day moving average below price, which often serves as the first stopping point for a pullback
- Fibonacci retracement: Key retracement levels of the prior advance (38.2%, 50%, 61.8%)
| Component | Specification |
|---|---|
| Body Position | Bottom of candle range |
| Upper Wick | Minimum 2x body length |
| Lower Wick | Minimal or absent |
| Body Color | Red preferred, green acceptable |
| Context | Top of uptrend |
| Confirmation | Bearish close next session |
| Stop Loss | Above shooting star high |
Shooting Star vs. Related Patterns
Several patterns share visual similarities with the shooting star.
vs. Inverted Hammer
The inverted hammer is structurally identical to the shooting star but appears during a downtrend. While the shooting star is bearish, the inverted hammer is bullish. The same shape at the bottom of a decline signals that buyers are starting to push higher, even though they could not maintain the gains in that session. Context determines whether the pattern is a shooting star (bearish) or inverted hammer (bullish).
vs. Hanging Man
The hanging man has the opposite wick structure: small body at the top with a long lower shadow. Like the shooting star, the hanging man appears during uptrends and carries bearish implications. Both patterns signal potential reversals at tops, but they tell different stories. The shooting star shows rejection of higher prices (sellers pushing down from above), while the hanging man shows that sellers are testing lower prices (selling pressure from below).
vs. Gravestone Doji
The gravestone doji is similar to the shooting star but has virtually no real body (the open and close are nearly identical). When the doji appears with a long upper wick at the top of an uptrend, it functions like an extreme version of the shooting star. The gravestone doji represents even more complete indecision than the shooting star, making it a marginally stronger signal.
vs. Bearish Engulfing
The bearish engulfing is a two-candle pattern that confirms the reversal within its own structure. The shooting star requires external confirmation from the next candle. The engulfing pattern is generally considered more reliable because it includes its own confirmation, but the shooting star provides an earlier warning that can be used to tighten stops on existing long positions even before confirmation arrives.
Pro Tip
Volume Analysis with the Shooting Star
Volume provides critical additional context for evaluating shooting stars.
High volume on the shooting star significantly strengthens the signal. High volume means that the battle between buyers and sellers during the session involved substantial participation. The fact that sellers won despite high buying activity shows genuine selling pressure, not just a thin-market anomaly.
Above-average volume on the shooting star is the minimum threshold for a tradeable signal. Shooting stars on very low volume may simply reflect a lack of buying interest rather than active selling, which is a less reliable reversal indicator.
Volume on the confirmation candle should also be above average. If the confirmation candle closes bearish on strong volume, it proves that selling interest persists and is building. A bearish confirmation candle on weak volume may indicate a half-hearted follow-through that is more likely to reverse.
Volume divergence during the uptrend adds context. If volume has been declining during the advance leading up to the shooting star, the pattern carries more weight because the declining volume was already signaling weakening buyer conviction. The shooting star then becomes the climactic final attempt by a diminishing buyer base.
Shooting Star at Different Price Levels
The significance of a shooting star depends heavily on where it forms relative to key price levels.
At major resistance. A shooting star at a well-established resistance level combines two bearish signals: the pattern's inherent reversal implication and the proven supply zone at that price. This is the highest-probability shooting star setup.
At round numbers. Psychological price levels (such as $100, $200, $500) often act as natural resistance. A shooting star at a round number suggests that the psychological barrier is holding and the stock is unlikely to push through on this attempt.
At Fibonacci extension levels. When a rally extends to a Fibonacci extension level (127.2%, 161.8%) and a shooting star forms, the confluence of pattern and Fibonacci level creates a compelling bearish setup.
Near declining moving averages. If the 50-day or 200-day moving average is declining and the stock rallies to test it from below, a shooting star at the moving average signals failure at dynamic resistance.
At the upper Bollinger Band. A shooting star that touches or exceeds the upper Bollinger Band shows that price has stretched beyond its normal volatility range and is being rejected, adding another layer of bearish evidence.
Combining with Momentum Indicators
The shooting star's reliability increases substantially when combined with momentum confirmation.
Overbought RSI. When the RSI is above 70 (overbought) and a shooting star forms, the combination suggests that upward momentum is exhausted and a pullback is likely. This is one of the most popular confluences used by professional traders.
Bearish RSI divergence. If the RSI has been making lower highs while the stock makes higher highs, and a shooting star appears at the most recent high, the divergence confirms that momentum was already fading. The shooting star becomes the visual confirmation of what the RSI divergence was warning about.
MACD signal. A MACD bearish crossover (the MACD line crossing below the signal line) near the time of the shooting star adds momentum confirmation to the pattern. The two signals together provide a stronger case for a short position.
Stochastic overbought. When the stochastic oscillator is above 80 and a shooting star forms, the momentum indicator confirms that the stock is stretched to the upside and vulnerable to a reversal.
Common Mistakes with Shooting Stars
Avoid these frequent errors.
Confusing the shooting star with the inverted hammer. Remember, context is everything. The same candle shape at the bottom of a downtrend is an inverted hammer (bullish), not a shooting star. Always check the preceding trend before classifying the pattern.
Trading without confirmation. The shooting star is a warning, not a sell signal. Acting before the next candle confirms the reversal leads to trading many false signals. Patience is a virtue with single-candle patterns.
Ignoring the upper shadow length. A candle with an upper shadow only slightly longer than the body is not a strong shooting star. Look for shadows at least twice the body length. The longer the shadow, the more convincing the rejection of higher prices.
Over-relying on a single pattern. No single candle pattern is sufficient for a trading decision. Always use the shooting star as one piece of evidence within a broader analysis that includes support and resistance, volume, and indicators.
Shooting Stars in Different Markets
The pattern appears across all traded markets with subtle differences.
In stocks, shooting stars are particularly effective at prior all-time highs, earnings-driven highs, and sector resistance levels. The defined market hours create clear session boundaries that make the open and close meaningful reference points.
In forex, shooting stars on the daily chart work well at major psychological levels and historical resistance zones. The 24-hour market means the "session" is defined by the daily close time, which varies by broker. Use a consistent close time for reliable analysis.
In cryptocurrency, shooting stars can signal powerful reversals given the extreme momentum that characterizes crypto markets. However, wider stops are necessary to account for the higher volatility. A crypto shooting star with an upper wick that would be unusual in stocks may be relatively normal in the crypto context, so adjust your expectations accordingly.
In futures and commodities, shooting stars at prior contract highs, seasonal resistance levels, or at the extremes of trading ranges provide excellent swing trading opportunities.
Frequently Asked Questions
How reliable is the shooting star as a reversal signal?
The shooting star, when properly confirmed by a bearish follow-through candle, has an estimated reliability rate of 55-65%. This rate improves when the pattern forms at a significant resistance level (65-75%), when volume is above average, and when momentum indicators confirm overbought conditions. The shooting star is most reliable on the daily chart and above. On lower timeframes, the reliability decreases because single-candle patterns are more susceptible to noise. Always require confirmation and use a stop loss regardless of how strong the setup appears.
Does the body color of the shooting star matter?
A bearish (red) body is slightly preferred because it shows sellers pushed the close below the open, reinforcing the bearish narrative. However, a bullish (green) shooting star is still a valid pattern because the critical element is the long upper shadow showing rejection of higher prices, not the small difference between the open and close. In practice, both colors produce similar results when all other criteria (trend context, location, volume, confirmation) are met. Focus on the shadow length and context rather than the body color.
What if the shooting star appears in the middle of a trading range?
A shooting star in the middle of a range, without a clear preceding uptrend, is less meaningful. The pattern derives its predictive power from appearing at the end of an advance, where it signals the exhaustion of buying momentum. In a range-bound market, similar-looking candles may form frequently without leading to directional moves. Save your shooting star trades for clear uptrend situations where the pattern represents a potential trend reversal, not just a random fluctuation within a range.
Can I trade shooting stars on a 5-minute chart?
While shooting stars appear on all timeframes, they are less reliable on very short timeframes like the 5-minute chart. The noise-to-signal ratio is much higher on intraday charts, and single-candle patterns are particularly susceptible to false signals. If you trade shooting stars on intraday charts, combine them with strong additional confirmation: they should form at major intraday levels (VWAP, prior day high, major round number), volume should be clearly above the intraday average, and the preceding intraday uptrend should be well-defined. Even then, expect a lower success rate than on the daily chart.
How is the shooting star different from a bearish pin bar?
The shooting star and bearish pin bar are essentially the same formation described using different terminology. "Shooting star" comes from the Japanese candlestick tradition, while "pin bar" (short for Pinocchio bar) is a term used by price action traders. Some price action practitioners require a slightly longer wick-to-body ratio for a pin bar (3:1 versus 2:1 for a shooting star), and they may have different rules about the body position relative to the prior candle. In practice, both terms describe the same phenomenon: a candle with a long wick showing rejection of a price level. Use whichever terminology aligns with your trading methodology.
Disclaimer
This is educational content, not financial advice. Trading involves risk, and you should consult a qualified financial advisor before making any investment decisions. Past performance does not guarantee future results.
12 chapters covering charts, indicators, risk management & more. Plus weekly trading insights.