Dead Cat Bounce: Why Stocks Rally Before Falling Further
⚡ Key Takeaways
- A dead cat bounce is a temporary recovery in the price of a declining stock, followed by a continuation of the downtrend — the "bounce" lulls traders into believing a reversal has begun
- The pattern consists of three phases: a sharp decline (the initial drop), a temporary recovery (the bounce, typically 10-25% of the decline), and a continuation lower (resumption of the downtrend)
- Volume is the most reliable clue for distinguishing a dead cat bounce from a real reversal — bounces occur on declining volume while genuine reversals show increasing volume
- The phrase originates from the morbid Wall Street saying that "even a dead cat will bounce if dropped from high enough" — the bounce does not mean the cat is alive
- The primary trading lesson is do not buy the bounce in a strong downtrend without confirmation of a genuine trend change through volume, breadth, and fundamental improvement
What Is a Dead Cat Bounce?
A dead cat bounce is a brief, temporary recovery in the price of a stock (or market) that is in the midst of a sustained decline. The bounce appears to signal that the worst is over and a reversal is underway, but it is actually just a pause before the price continues falling to new lows. It is one of the most deceptive patterns in trading because it punishes investors who mistake the temporary rally for a buying opportunity.
The term comes from the darkly humorous Wall Street adage: "Even a dead cat will bounce if it falls from a great height." The bounce does not indicate life — it is simply a mechanical response to the force of the fall. In market terms, the bounce is typically caused by short sellers covering positions to lock in profits, bargain hunters stepping in too early, and temporary exhaustion of selling pressure.
Identifying dead cat bounces correctly is crucial for protecting your capital. Buying into one means catching a falling knife — you think you are getting a bargain but instead you are adding to losses as the decline resumes.
Anatomy of a Dead Cat Bounce
The dead cat bounce unfolds in three distinct phases.
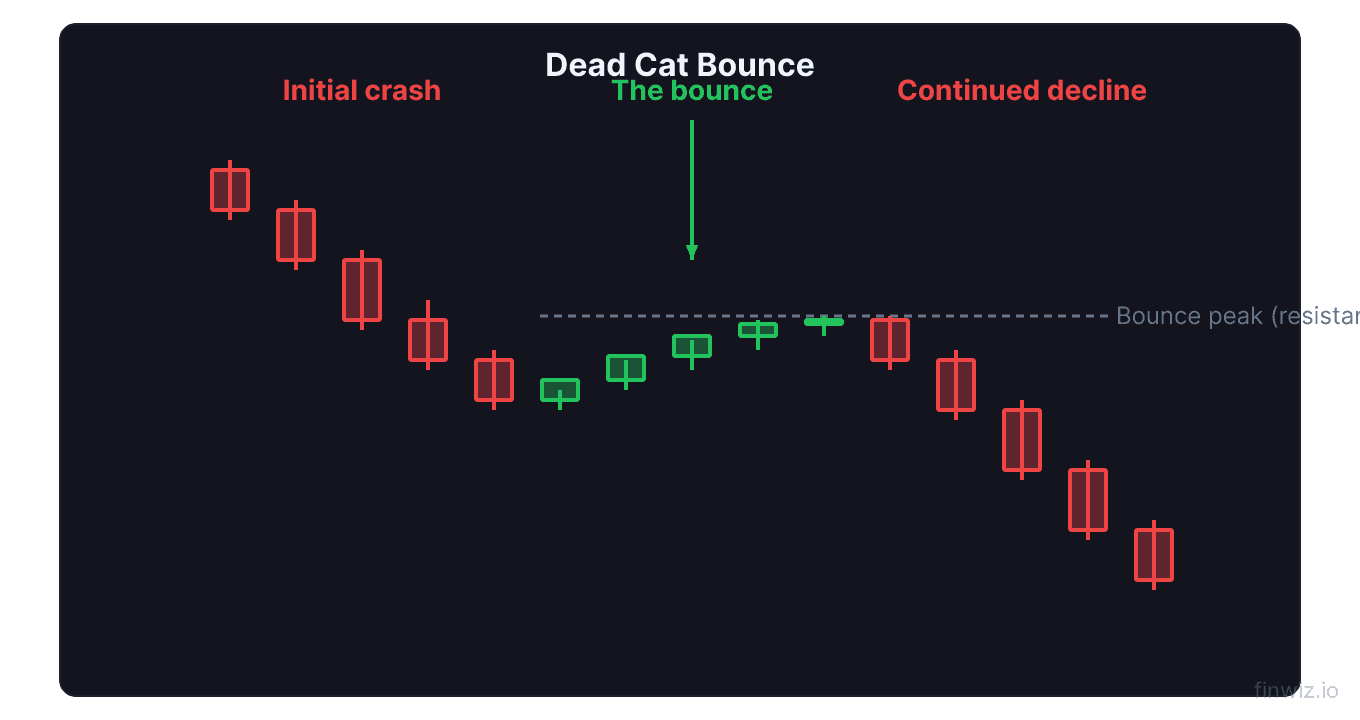
Phase 1: The Sharp Decline
The pattern begins with a significant, rapid decline in the stock's price. This is not a gentle drift lower — it is a sharp, often alarming drop triggered by a major catalyst: devastating earnings, sector-wide selling, loss of a key customer, regulatory action, or market crash.
The decline is typically 20-50% or more from the recent high and occurs over days to weeks (not months). The speed and magnitude of the decline are important — dead cat bounces follow violent drops, not slow grinds lower.
Volume during the decline is typically very high, reflecting panic selling and forced liquidation. The emotional intensity of the selloff creates the conditions for the subsequent bounce.
Phase 2: The Bounce (Recovery)
After the sharp decline, the stock temporarily recovers. This bounce typically retraces 10-25% of the initial decline (a modest recovery relative to the damage already done).
Dead Cat Bounce Retracement:The bounce lasts anywhere from a few days to several weeks. It is fueled by:
- Short covering: Traders who shorted the decline buy shares to close their profitable short positions, creating buying pressure
- Bargain hunters: Investors who see the beaten-down price as a buying opportunity, not realizing the decline may continue
- Technical buying: Algorithmic systems that trigger buy signals at oversold levels (RSI below 30, for example)
- Relief rally: The sheer absence of new selling creates space for a temporary uptick
Phase 3: Continuation Lower
The bounce fails, and the stock resumes its decline, eventually breaking below the prior low. The bargain hunters are now trapped with losses, the fundamental problems that caused the original decline remain unresolved, and sellers who paused during the bounce return with renewed force.
This final phase often accelerates as disappointed bounce buyers panic and sell, adding to the selling pressure. The stock may ultimately decline 30-70% or more from where the dead cat bounce peaked.
Pro Tip
The dead cat bounce is most dangerous in stocks that were once momentum favorites or widely held names. When a beloved stock drops 40%, the temptation to "buy the dip" is overwhelming because investors have emotional attachment and anchoring bias to the former higher prices. This is precisely why the pattern is so effective at trapping buyers.
How to Identify a Dead Cat Bounce vs. a Real Reversal
Distinguishing between a dead cat bounce and a genuine bottom is the key skill. Several characteristics differentiate them.
Volume Analysis
Volume is the single most important differentiator.
- Dead cat bounce: The bounce occurs on declining or below-average volume. There is not enough buying conviction to sustain the recovery. Each day of the bounce shows less volume than the previous day.
- Real reversal: A genuine bottom typically features a volume climax — an extreme spike in volume on the final down day — followed by strong volume on the recovery. Heavy buying volume indicates that large, informed investors are accumulating shares, not just short sellers covering.
Price Action Quality
- Dead cat bounce: The bounce is choppy, with many intraday reversals and long upper wicks on candlesticks. The stock struggles to hold gains from one day to the next. It fails at obvious resistance levels (former support that becomes resistance, declining moving averages).
- Real reversal: Genuine reversals show cleaner, more decisive price action. The stock closes near its highs consistently, forms higher lows, and breaks through resistance with conviction. Bullish candlestick patterns like hammers and engulfing patterns appear with volume confirmation.
Fundamental Context
- Dead cat bounce: The fundamental problem that caused the decline has not been resolved. Earnings are still declining, the competitive threat remains, the regulatory issue persists. The bounce is driven by technical factors (oversold conditions) rather than genuine improvement.
- Real reversal: The fundamental catalyst for the decline has been addressed or priced in. New positive developments emerge. Management provides a credible turnaround plan. The company's financial metrics begin stabilizing or improving.
Breadth and Sector Confirmation
- Dead cat bounce: If the individual stock is bouncing but its sector and the broader market are still declining, the bounce is more likely to fail. A stock cannot sustain a recovery against a hostile sector and market backdrop.
- Real reversal: Genuine reversals often coincide with sector rotation or broader market breadth improvement. The stock's recovery is supported by its sector peers and the market's overall direction.
Real-World Dead Cat Bounce Examples
Lehman Brothers (2008)
Lehman Brothers' stock declined from $82 in January 2008 to $16 by early September. It then bounced to approximately $25 (a 56% bounce) over a few days in mid-September on rumors of a potential rescue deal. When the rescue fell through, the stock collapsed to zero within days as the firm declared bankruptcy. Buyers of the bounce lost everything.
Bitcoin (2022)
After peaking near $69,000 in November 2021, Bitcoin declined to approximately $33,000 by January 2022. It then bounced to about $48,000 (a 45% bounce) by late March. This appeared to be a recovery — but it was a dead cat bounce. Bitcoin resumed its decline, eventually falling to approximately $15,500 by November 2022. Those who bought the bounce at $48,000 suffered another 68% decline.
COVID Bounce Attempts (2020)
During the March 2020 crash, the S&P 500 experienced two notable dead cat bounces before finding its ultimate bottom. The first bounce of approximately 6% occurred on March 13, followed by another decline. A second bounce of approximately 8% occurred on March 17, which also failed. The genuine bottom did not arrive until March 23. Traders who bought the first two bounces endured additional drawdowns before the true recovery began.
Trading Rules: How to Handle Potential Dead Cat Bounces
Rule 1: Do Not Buy the First Bounce
After a severe decline, the first bounce is the most likely to be a dead cat bounce. Wait for a retest of the lows or a confirmed trend change (higher low followed by higher high) before committing capital. Patience costs nothing; buying too early can cost a great deal.
Rule 2: Watch the Moving Averages
A stock in a dead cat bounce will typically fail at or below its 200-day moving average (or 50-day in shorter-term patterns). If the stock bounces to its declining 200-day MA and reverses, the downtrend is intact. A genuine reversal would involve reclaiming and holding above the 200-day MA with volume.
Rule 3: Use a Tight Stop If You Trade It
If you choose to buy a bounce (which experienced traders sometimes do for short-term profits), use an extremely tight stop-loss. Set it just below the most recent support level or the bounce low. If the bounce fails, exit immediately. Do not turn a short-term bounce trade into a long-term hold based on hope.
Rule 4: Check the Fundamentals
Before buying any beaten-down stock, read the financial statements. Is the company generating free cash flow? Is the debt level manageable? Is revenue stabilizing? If the fundamentals are deteriorating, the price probably will too — regardless of how oversold the stock looks technically.
Pro Tip
One of the most reliable ways to avoid dead cat bounces is to require that the stock form a double bottom, head and shoulders bottom, or other established bottoming pattern before buying. These patterns take time to develop (weeks to months), which naturally prevents you from buying the first impulsive bounce. Pattern-confirmed entries have a much higher success rate than bottom-picking attempts.
Short Selling Dead Cat Bounces
Some traders specifically look for dead cat bounces as short selling opportunities. The strategy involves waiting for the bounce to exhaust itself and then shorting the stock as it rolls over, expecting a continuation of the downtrend.
Entry criteria for shorting a dead cat bounce:
- Stock has declined 30%+ on heavy volume
- Bounce occurs on declining volume (lacks conviction)
- Bounce reaches a resistance level (prior support, declining moving average, Fibonacci retracement)
- A bearish candlestick pattern forms at resistance (shooting star, evening star, engulfing)
- Stop above the bounce high
- Target: retest of the prior low (or a new low)
Short selling carries unlimited risk in theory (since there is no cap on how high a stock can go), so strict risk management is essential. Never short without a defined stop-loss.
Frequently Asked Questions
How long does a dead cat bounce typically last?
Dead cat bounces typically last a few days to a few weeks. The bounce in Lehman Brothers lasted about four trading days. Bitcoin's 2022 bounce lasted approximately two months. Shorter bounces (under a week) are easier to identify because the recovery is so brief that it cannot establish any meaningful trend. Longer bounces (2-4 weeks) are more deceptive because they can create the illusion of a genuine trend change.
Can a dead cat bounce turn into a real reversal?
Yes, but this is the exception rather than the rule. If the fundamental catalyst that caused the decline is resolved during the bounce period (a buyout offer arrives, FDA approval is granted, earnings surprise to the upside), the dead cat bounce can transition into a genuine recovery. The key distinction is whether something fundamentally changes during the bounce or whether the bounce is purely technical.
Is "buying the dip" always a dead cat bounce?
No. Buying the dip is a legitimate strategy in a healthy uptrend — purchasing a stock that has pulled back temporarily within a larger bull trend. A dead cat bounce specifically refers to a temporary recovery within a major downtrend. The context matters enormously. A 5% pullback in a stock making new highs is a dip. A 15% bounce in a stock that just dropped 40% is a potential dead cat bounce.
How do I know if a stock has bottomed?
No one can identify the exact bottom in real time. However, signs of a genuine bottom include: volume climax on the final low (exhaustion selling), a successful retest of the low with lower volume and bullish divergence on momentum indicators, a break above the declining 50-day moving average with volume, and improving fundamentals. Waiting for confirmation means you miss the exact bottom, but it dramatically reduces the risk of buying into a dead cat bounce.
Do dead cat bounces occur in entire markets, not just individual stocks?
Yes. Bear markets often feature one or more dead cat bounces. The 2008 bear market included several countertrend rallies of 10-20% before the ultimate bottom in March 2009. The 2000-2002 bear market featured a significant rally in late 2001 that was ultimately a dead cat bounce before the final decline into October 2002. These market-level bounces are especially deceptive because they involve broad participation and generate enormous optimism.
Disclaimer
This is educational content, not financial advice. Trading involves risk, and you should consult a qualified financial advisor before making any investment decisions. Past performance does not guarantee future results.
Related Articles
12 chapters covering charts, indicators, risk management & more. Plus weekly trading insights.