Head and Shoulders Pattern: How to Identify & Trade It
⚡ Key Takeaways
- The head and shoulders pattern is one of the most reliable reversal patterns in technical analysis, signaling a shift from bullish to bearish momentum.
- The pattern consists of three peaks: a left shoulder, a higher head, and a right shoulder, connected by a neckline that acts as the trigger level.
- The inverse head and shoulders is the bullish counterpart, appearing at market bottoms and signaling a potential uptrend reversal.
- Volume typically decreases across the three peaks and expands on the neckline break, providing critical confirmation.
- The measured move target equals the distance from the head to the neckline, projected downward from the breakout point.
What Is the Head and Shoulders Pattern?
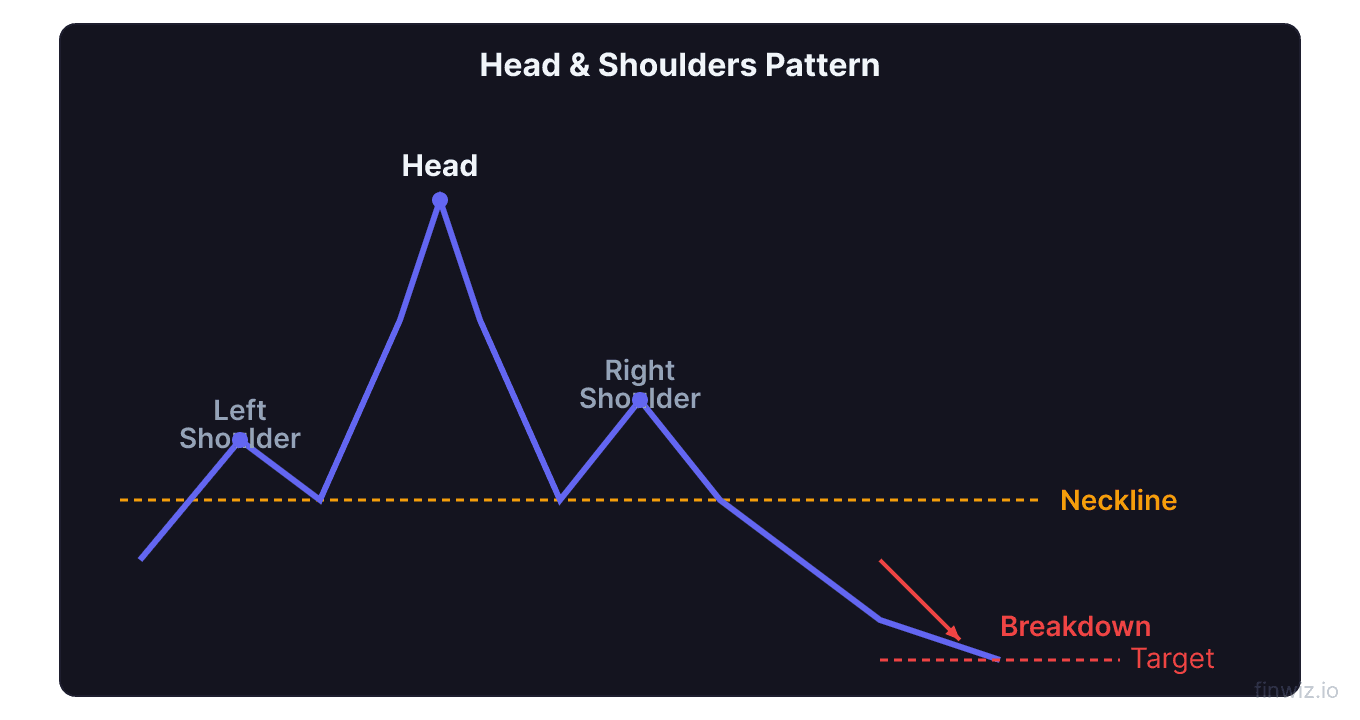
The head and shoulders pattern is a classic chart formation that signals the reversal of an uptrend into a downtrend. Widely regarded as one of the most reliable patterns in technical analysis, it appears at market tops and warns traders that bullish momentum is fading.
The pattern gets its name from its distinctive shape: three peaks that resemble a person's head flanked by two shoulders. The middle peak (the head) is the highest, while the two outer peaks (the shoulders) are lower and roughly equal in height. A trendline called the neckline connects the lows between the peaks.
When price breaks below the neckline, the pattern is confirmed, and traders expect a significant decline. The pattern works because it visually maps the transition from higher highs and higher lows (an uptrend) to a lower high (the right shoulder), signaling that buyers are losing control.
Structure of the Head and Shoulders Pattern
Understanding each component of the pattern is essential for accurate identification and timing.
Left Shoulder
The left shoulder forms as the uptrend makes a new high, followed by a pullback. This peak looks like a normal continuation of the trend. Volume is typically strong during this rally, consistent with the prevailing uptrend. The pullback from this peak establishes the first anchor point of the neckline.
Head
The head is the highest point of the pattern. Price rallies above the left shoulder's peak, setting a new high for the trend. However, volume during this rally often shows subtle signs of weakening compared to the left shoulder. The subsequent decline pulls price back below the left shoulder's peak, creating a second anchor point for the neckline.
Right Shoulder
The right shoulder is the critical component that defines the pattern. Price rallies again but fails to reach the height of the head, creating a lower high. This failure demonstrates that buyers can no longer push prices to new highs. Volume during the right shoulder rally is typically the lightest of the three peaks, confirming weakening demand.
Neckline
The neckline connects the two reaction lows between the three peaks. It can be horizontal, slope upward, or slope downward. A downward-sloping neckline is generally considered more bearish, while an upward-sloping neckline may produce a less dramatic breakdown. The neckline serves as the trigger point for the pattern.
Pro Tip
How to Confirm the Pattern
Identifying the shape is only part of the analysis. Confirmation through volume and the neckline break separates valid patterns from false signals.
Volume profile is the most important confirmation tool. The ideal volume pattern shows decreasing volume across the three peaks. The left shoulder has the highest volume, the head has moderate volume, and the right shoulder has the lowest volume. This declining volume reflects fading buying interest and is a hallmark of a genuine head and shoulders formation.
Neckline break confirms the pattern. Until price closes below the neckline, the pattern remains unconfirmed. Many traders wait for a daily close below the neckline rather than acting on an intraday breach, which reduces the risk of a false breakdown.
Expansion of volume on the break adds further confirmation. When the neckline breaks on increasing volume, it shows that sellers are aggressively entering the market, making the breakdown more likely to follow through.
Measuring the Price Target
The head and shoulders pattern provides a built-in method for calculating a minimum price target after the breakdown.
Price Target = Neckline Price - (Head Price - Neckline Price)Measure the vertical distance from the top of the head to the neckline. Then subtract that distance from the neckline at the point of the breakdown. This gives you the measured move target, which represents the minimum expected decline.
For example, if the head peaks at $150 and the neckline sits at $130, the distance is $20. The price target would be $130 - $20 = $110. This target is a minimum expectation; the actual decline can be significantly larger, especially in strong downtrends.
Keep in mind that the measured move is a guideline, not a guarantee. Some breakdowns will fall short of the target, while others will exceed it. Use the target in conjunction with other support levels to identify potential stopping points.
Trading the Head and Shoulders Breakdown
There are several approaches to entering a trade based on this pattern, each with its own risk-reward tradeoff.
Aggressive Entry
Enter short immediately when price breaks below the neckline on an intraday basis. This approach captures the earliest part of the move but carries higher risk of a false breakdown. Place your stop loss above the right shoulder to define maximum risk.
Conservative Entry
Wait for a daily close below the neckline, then enter short on the following session's open or on a retest of the neckline from below. Many successful breakdowns will pull back to test the neckline as resistance before continuing lower. This approach sacrifices some profit potential but significantly reduces the risk of being caught in a false breakdown.
Stop Loss Placement
The most common stop loss location is above the right shoulder. This level invalidates the pattern because if price exceeds the right shoulder, the formation of lower highs has broken down. Some traders use a tighter stop just above the neckline after the retest, accepting a smaller loss if the pattern fails but requiring more precise timing.
| Entry Method | Entry Point | Stop Loss | Risk Level | Reward Potential |
|---|---|---|---|---|
| Aggressive | Intraday neckline break | Above right shoulder | High | Highest |
| Conservative | Close below neckline | Above right shoulder | Moderate | Moderate |
| Retest Entry | On neckline retest | Above neckline | Low | Lower |
Pro Tip
The Inverse Head and Shoulders
The inverse head and shoulders (also called the head and shoulders bottom) is the bullish counterpart of the standard pattern. It appears at the end of downtrends and signals a potential reversal to the upside.
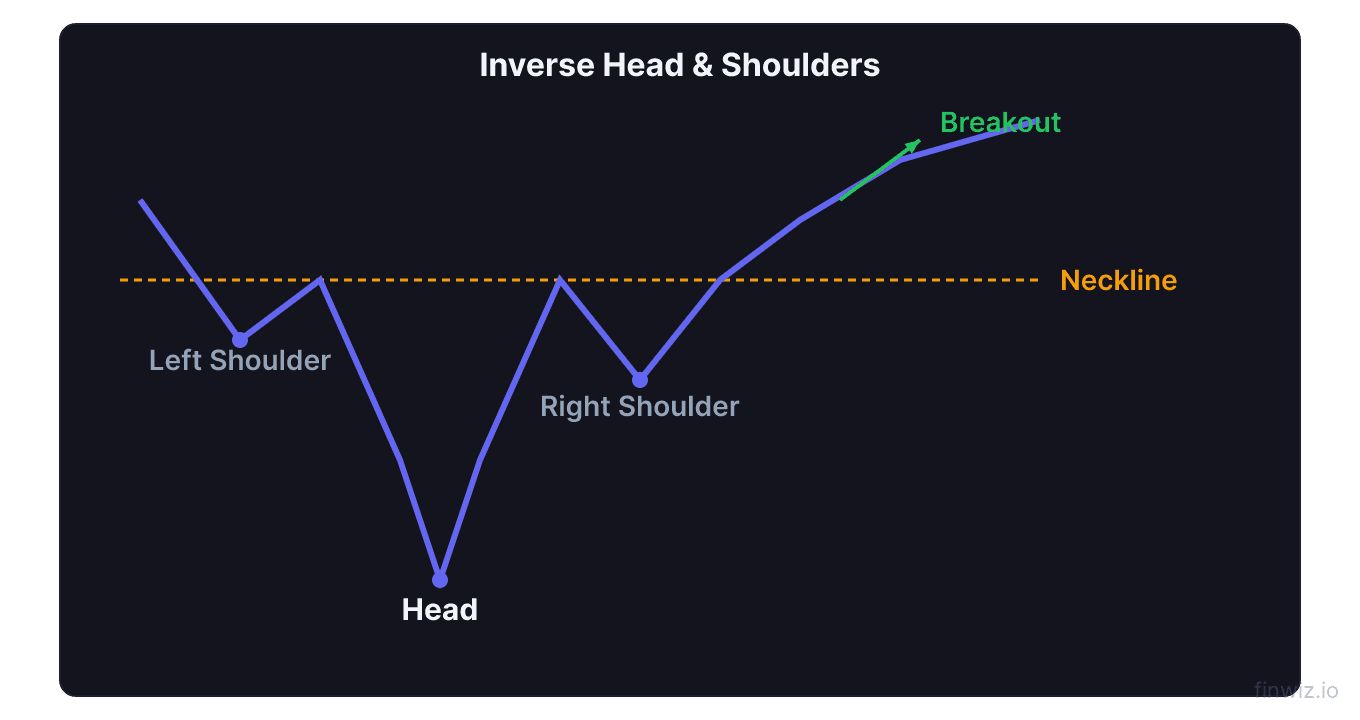
The structure is a mirror image: three troughs with the middle trough (the head) being the deepest and the two outer troughs (the shoulders) being shallower and roughly equal. The neckline connects the two reaction highs between the troughs.
Volume behavior is slightly different in the inverse pattern. While declining volume across the three troughs is still typical, the breakout above the neckline should occur on noticeably higher volume. Volume confirmation is considered even more important for inverse patterns because reversals from downtrends to uptrends typically require significant buying pressure to overcome the prevailing bearish sentiment.
The measured move target calculation is the same: measure the distance from the head to the neckline and project it upward from the breakout point.
Common Variations and Nuances
Real-world head and shoulders patterns rarely look like textbook examples. Understanding common variations helps you identify valid patterns in live markets.
Complex Head and Shoulders
A complex head and shoulders may feature multiple left shoulders, multiple right shoulders, or even a double head. These patterns take longer to form and can be harder to identify in real time, but they carry the same implications as the standard formation. The key requirement remains a series of peaks that shows the market transitioning from higher highs to lower highs.
Slanted Neckline
Necklines are often angled rather than perfectly horizontal. A downward-slanting neckline (from left to right) is more bearish because it shows the reaction lows are getting progressively lower even before the pattern completes. An upward-slanting neckline is less bearish and may produce a less dramatic breakdown.
Failed Head and Shoulders
Not every head and shoulders pattern results in a successful breakdown. A failed head and shoulders occurs when price breaks below the neckline but quickly reverses and rallies back above it. Failed patterns can trigger powerful moves in the opposite direction, as trapped short sellers are forced to cover their positions. Always use a stop loss to protect against this scenario.
Head and Shoulders vs. Other Reversal Patterns
The head and shoulders is often compared to other reversal formations. Understanding the differences helps you choose the right pattern for the current market context.
Compared to the double top, the head and shoulders provides more information because the right shoulder gives an additional data point about weakening momentum. A double top shows two equal highs and a failure to break higher, while the head and shoulders shows an explicit lower high, which is a stronger bearish signal.
Compared to rising wedge patterns, the head and shoulders is typically more dramatic and produces faster breakdowns. Rising wedges tend to grind gradually lower after breaking support, while head and shoulders breakdowns can be sharp and sudden.
The head and shoulders also differs from candlestick reversal patterns in timeframe. While candlestick patterns can form in a single session, a head and shoulders typically takes weeks or months to develop on the daily chart, making it a more significant structural signal.
Real-World Trading Considerations
Several practical factors affect how you should trade this pattern in live markets.
Timeframe matters. Head and shoulders patterns on the daily and weekly charts are far more reliable than those on intraday charts. A pattern that takes three months to form on the daily chart represents a significant shift in market sentiment. A pattern on a 15-minute chart may simply be noise within a larger trend.
Market context is critical. A head and shoulders pattern in a stock that has been in an uptrend for years carries different weight than one in a stock that has only rallied for a few weeks. Longer-term trends produce more significant reversal patterns.
Sector and market conditions affect reliability. If the broader market is in a strong uptrend, individual stock head and shoulders patterns may fail more frequently as the rising tide lifts all boats. Conversely, when the overall market is rolling over, individual head and shoulders patterns have a higher probability of working.
Use RSI divergence as an additional filter. If the RSI makes a lower high at the right shoulder compared to the head, this bearish divergence adds strong confirmation that momentum is fading. The more confluence signals you can stack, the higher the probability of a successful trade.
Risk Management for Head and Shoulders Trades
Proper risk management is essential when trading any chart pattern, and the head and shoulders is no exception.
Position sizing should be based on the distance between your entry and stop loss. If the stop is far above your entry (for example, above the right shoulder), reduce your position size to keep dollar risk within your tolerance. Never risk more than 1-2% of your trading account on a single trade.
Partial profit-taking can improve your overall results. Consider taking half your position off at the halfway point to the measured move target and letting the remainder run with a trailing stop. This locks in some profit while allowing you to capture a larger move if the decline extends beyond the target.
Time stops are also useful. If price breaks the neckline but then goes sideways for an extended period without moving toward the target, the pattern may be losing its energy. Consider exiting or reducing your position if the trade is not working within a reasonable timeframe.
Keep a trading journal and record every head and shoulders trade you take. Over time, you will develop a sense for which variations work best in your market and timeframe. This pattern-specific data is invaluable for refining your trading psychology and approach.
Frequently Asked Questions
How long does a head and shoulders pattern take to form?
The formation time varies widely depending on the timeframe you are analyzing. On a daily chart, a typical head and shoulders pattern takes several weeks to several months to complete. On a weekly chart, it can take many months or even over a year. On intraday charts, the pattern can form within hours. Generally, patterns that take longer to form are more significant and produce larger moves when they break down. The key is that each component (left shoulder, head, right shoulder) should have enough time to develop clearly, with distinct rallies and pullbacks.
What happens if the neckline is broken but the pattern fails?
A failed head and shoulders pattern occurs when price breaks below the neckline but quickly reverses and moves back above it. This failure can trigger a powerful rally because short sellers who entered on the breakdown are forced to buy back their positions (cover their shorts), adding buying pressure. If you are short and price moves back above the neckline, exit the trade to limit losses. Some traders even reverse their position and go long after a confirmed failure, as the trapped shorts can fuel a significant upside move.
Is the inverse head and shoulders as reliable as the standard pattern?
The inverse head and shoulders is generally considered slightly less reliable than the standard pattern, primarily because reversals from downtrends to uptrends require stronger buying conviction. Market bottoms tend to be more volatile and erratic than market tops. However, when the inverse pattern is confirmed with strong volume on the neckline breakout and supported by bullish divergence on momentum indicators, it can produce substantial rallies. Volume confirmation is particularly critical for the inverse version.
Can the head and shoulders pattern appear on any timeframe?
Yes, the head and shoulders pattern can appear on any timeframe from 1-minute charts to monthly charts. However, patterns on higher timeframes (daily, weekly, monthly) are significantly more reliable and tend to produce larger price moves. Intraday head and shoulders patterns can be traded but should be approached with greater caution, tighter stops, and smaller position sizes. Many professional traders only act on head and shoulders patterns that form on the daily chart or higher.
How do I distinguish between a head and shoulders and a normal pullback?
The key distinction is the right shoulder. In a normal pullback within an uptrend, price will eventually make a new high. In a head and shoulders pattern, the right shoulder rally fails to reach the height of the head, creating a lower high. Additionally, declining volume across the three peaks supports the head and shoulders interpretation, while increasing volume on rallies suggests the uptrend remains healthy. Wait for the neckline break to confirm the pattern rather than trying to predict it during formation.
Disclaimer
This is educational content, not financial advice. Trading involves risk, and you should consult a qualified financial advisor before making any investment decisions. Past performance does not guarantee future results.
Related Articles
12 chapters covering charts, indicators, risk management & more. Plus weekly trading insights.