Harami Pattern: Bullish & Bearish Inside Candle Reversals
⚡ Key Takeaways
- The harami is a two-candle reversal pattern where the second candle
- s body, signaling a potential shift in momentum.
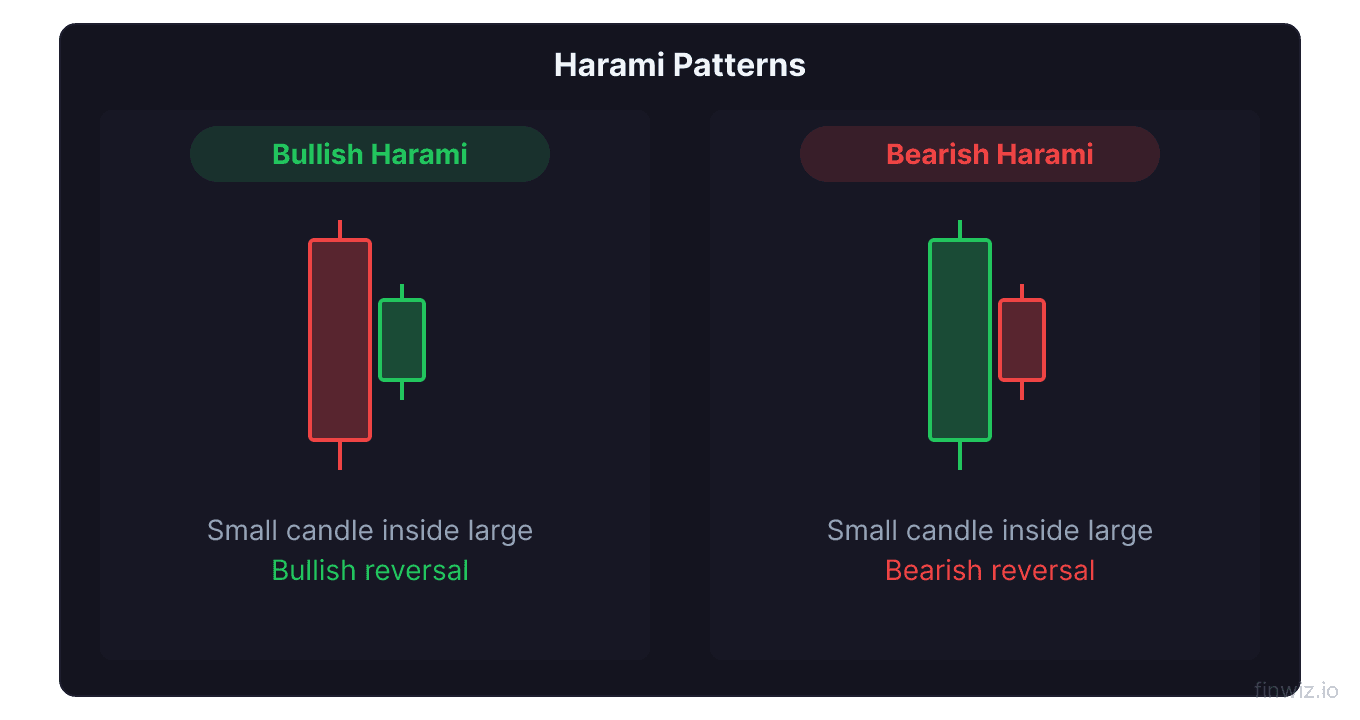
- A bullish harami forms at the bottom of a downtrend (large red candle followed by a small green candle), while a bearish harami forms at the top of an uptrend (large green candle followed by a small red candle).
- The harami cross — where the second candle is a doji — is considered a stronger variation because the doji represents complete indecision after a strong directional move.
- Confirmation on the third candle is essential: a close beyond the second candle in the expected reversal direction validates the pattern.
- The harami is a weaker reversal signal than the engulfing pattern and works best when combined with support/resistance levels, volume analysis, and momentum indicators.
What Is the Harami Pattern?
The harami pattern is a two-candle reversal formation in Japanese candlestick analysis. The name comes from the Japanese word for "pregnant," because the pattern visually resembles a pregnant woman — a large candle (the mother) containing a smaller candle (the child) within its body.
The harami consists of a large-bodied candle followed by a smaller candle whose real body is completely contained within the real body of the first candle. This containment signals that the prevailing momentum has stalled and that a reversal or consolidation may follow.
Unlike more aggressive patterns like the engulfing pattern, the harami is a subtle signal. It does not show a dramatic shift in power but rather a gradual loss of momentum. Think of it as the market pausing to catch its breath after a strong move.
Bullish Harami: Structure and Psychology
The bullish harami forms at the bottom of a downtrend and signals a potential reversal to the upside.
Candle Structure
- First candle: A large bearish (red) candle that continues the existing downtrend. The large body shows strong selling pressure.
- Second candle: A small bullish (green) candle whose body fits entirely within the first candle's body. The small body shows that selling pressure has diminished dramatically.
Market Psychology
The first candle reflects confident selling — bears are in control and prices are dropping aggressively. But on the next session, something changes. Instead of continuing the decline, the market opens higher than the previous close and trades in a narrow range, closing with a small bullish body.
This tells us that sellers have lost conviction. The momentum that drove the first candle has evaporated. While this alone does not guarantee a reversal, it plants the seed of doubt about the downtrend's continuation.
Pro Tip
Bearish Harami: Structure and Psychology
The bearish harami forms at the top of an uptrend and warns that bullish momentum may be fading.
Candle Structure
- First candle: A large bullish (green) candle continuing the uptrend with strong buying pressure.
- Second candle: A small bearish (red) candle whose body is contained within the first candle's body.
Market Psychology
After aggressive buying produces the large green candle, the next session fails to follow through. Instead, the market opens lower than the previous close and trades in a tight range. The small bearish body reveals that buyers have lost their enthusiasm and cannot push prices higher. Sellers are beginning to match buyer activity.
This pattern frequently appears at resistance levels, round numbers, or after extended rallies where the uptrend has become overextended.
Harami Cross Variation
The harami cross is an enhanced version of the standard harami pattern. In this variation, the second candle is a doji — a candle where the open and close are virtually identical.
The doji represents absolute indecision. Following a large directional candle, this complete loss of conviction is a powerful warning signal. The harami cross is considered significantly more reliable than the standard harami.
| Pattern | Second Candle | Signal Strength | Frequency |
|---|---|---|---|
| Standard Bullish Harami | Small green body | Moderate | Common |
| Standard Bearish Harami | Small red body | Moderate | Common |
| Bullish Harami Cross | Doji | Strong | Less common |
| Bearish Harami Cross | Doji | Strong | Less common |
Harami vs. Engulfing Pattern
The harami and engulfing pattern are related but opposite formations. Understanding their differences helps you assess signal strength.
| Feature | Harami | Engulfing |
|---|---|---|
| Size relationship | Second candle smaller, contained within first | Second candle larger, engulfs first |
| Signal strength | Moderate | Strong |
| Momentum shift | Gradual, subtle | Aggressive, decisive |
| Confirmation need | Essential | Recommended but less critical |
| Best use | Early warning, position sizing adjustment | Direct entry signal |
The engulfing pattern shows an immediate and aggressive power shift — buyers or sellers overwhelm the opposing side in a single session. The harami merely shows a loss of momentum without confirming that the other side has taken control.
Because of this difference, the harami demands more patience and stricter confirmation than the engulfing pattern.
Confirmation and Validation
The harami pattern requires confirmation before traders should act on it. Without a third-candle confirmation, many harami patterns simply resolve as brief pauses before the existing trend resumes.
Bullish Harami Confirmation
For a bullish harami, the third candle should close above the high of the second candle and preferably above the midpoint of the first candle. A strong bullish confirmation candle that closes near its high provides the most reliable signal.
Bearish Harami Confirmation
For a bearish harami, the third candle should close below the low of the second candle and ideally below the midpoint of the first candle. Heavy volume on the confirmation candle adds credibility.
Volume Analysis
Volume behavior across the three candles tells a revealing story:
- First candle: High volume confirms strong directional conviction
- Second candle: Declining volume supports the indecision narrative
- Third candle (confirmation): Rising volume in the reversal direction validates the new trend
If volume does not support this pattern, treat the harami with skepticism. Use the Accumulation/Distribution line or On-Balance Volume for additional volume confirmation.
Trading the Harami Pattern
Entry Strategies
Conservative entry: Enter on the close of the confirmation candle (third candle in the sequence). This approach requires the most patience but offers the highest probability of a valid signal.
Moderate entry: Enter when the price breaks above the high of the second candle (bullish harami) or below the low of the second candle (bearish harami). Use a limit order at this level during the third session.
Aggressive entry: Enter at the close of the second candle (the small candle). This is only advisable when the harami forms at a significant support or resistance level with strong indicator confluence.
Stop Loss Placement
Bullish harami stop: Place the stop below the low of the first candle (the large red mother candle). This represents the extreme of the selling pressure.
Bearish harami stop: Place the stop above the high of the first candle (the large green mother candle). This represents the peak of buying pressure.
Profit Targets
- Nearest support/resistance level in the direction of the expected move
- Fibonacci retracement levels of the prior trend
- Risk-reward ratio targets: Aim for at least 2:1 reward-to-risk based on your stop distance
- Previous swing highs/lows that may act as natural target zones
Pro Tip
Harami in Different Market Contexts
Strong Trends
In powerful trending markets, harami patterns frequently fail. The brief pause represented by the second candle is simply the market digesting gains before continuing in the trend direction. Be especially cautious trading counter-trend harami signals during strong directional moves.
Range-Bound Markets
Harami patterns at the extremes of trading ranges — near established support and resistance — produce some of the most reliable signals. The range boundaries provide natural reversal zones that support the harami's implication.
Near Key Levels
The harami gains significance when it forms at:
- Major moving averages like the 50-day or 200-day moving average
- Fibonacci retracement levels (38.2%, 50%, 61.8%)
- Previous breakout levels being retested as support or resistance
- Volume profile nodes where significant trading activity previously occurred
Combining the Harami with Indicators
Using the harami alongside technical indicators creates a more robust trading system.
RSI readings. A bullish harami with an oversold RSI below 30, or a bearish harami with an overbought RSI above 70, is considerably more reliable.
MACD signal. A harami forming as the MACD histogram begins to flatten or diverge from price adds momentum confirmation.
Bollinger Band context. A bullish harami at the lower Bollinger Band or a bearish harami at the upper band aligns the reversal signal with a statistical extreme.
Stochastic crossover. A stochastic oscillator crossover in overbought or oversold territory at the time of a harami formation provides additional confirmation.
Common Mistakes to Avoid
Ignoring the trend requirement. The harami is a reversal pattern and requires a preceding trend. A harami in the middle of a sideways market has no directional implication.
Trading without confirmation. The harami is a moderate-strength pattern. Skipping confirmation leads to a low win rate.
Confusing real body containment with shadow containment. The harami definition requires the second candle's body to be contained within the first candle's body. The shadows (wicks) can extend beyond the first candle's body. If the second candle's body is not fully contained, it is not a valid harami.
Overrating the pattern. The harami is not among the most powerful reversal signals. It is best used as an early warning within a broader analytical framework, not as a standalone trade trigger.
Frequently Asked Questions
What does harami mean?
Harami is a Japanese word meaning "pregnant." The pattern gets its name because the second (smaller) candle is contained within the first (larger) candle, visually resembling a pregnant woman. Japanese candlestick terminology draws from traditional Japanese culture and natural imagery.
Is the harami a strong reversal signal?
The harami is considered a moderate-strength reversal signal. It is weaker than the engulfing pattern or morning star/evening star formations. Its strength increases substantially when it forms at key support/resistance levels, with volume confirmation, and with a strong third-candle confirmation.
How do I distinguish between a harami and a doji inside a large candle?
A standard harami has a small real body (either bullish or bearish) as the second candle. When the second candle is specifically a doji (open equals close), the pattern is classified as a harami cross, which is a stronger variation. Both are valid harami patterns, but the cross variant carries more weight.
Can the harami be used on any timeframe?
Yes, the harami appears across all timeframes from 1-minute to monthly charts. Daily charts provide the best balance of reliability and frequency. Intraday harami patterns produce more noise and require additional filtering. Weekly and monthly harami patterns are rare but carry significant weight.
What happens if the second candle gaps away from the first candle?
In stock markets, the second candle often gaps inside the first candle's body (opening within the first candle's range due to the overnight gap). In 24-hour markets like forex, true gaps are rare, so the containment occurs through normal price action. Both scenarios produce valid harami patterns as long as the body containment requirement is met.
Should I trade every harami pattern I see?
No. Selectivity is crucial with the harami pattern given its moderate reliability. Focus on harami patterns that form at key technical levels, show volume confirmation, align with indicator readings (overbought/oversold), and receive clear confirmation on the following candle.
Disclaimer
This is educational content, not financial advice. Trading involves risk, and you should consult a qualified financial advisor before making any investment decisions. Past performance does not guarantee future results.
12 chapters covering charts, indicators, risk management & more. Plus weekly trading insights.