Candlestick Patterns: The Complete Visual Guide
⚡ Key Takeaways
- Candlestick patterns are visual representations of price action that reveal buyer and seller psychology within a given time period.
- Single-candle patterns like the doji, hammer, and shooting star can signal potential reversals when they appear at key support or resistance levels.
- Multi-candle patterns such as engulfing candles, morning stars, and evening stars provide stronger confirmation signals than single-candle formations.
- Always confirm candlestick signals with volume analysis, trend context, and additional technical indicators before entering a trade.
- Candlestick patterns work best when combined with support and resistance levels, moving averages, and momentum oscillators.
What Are Candlestick Patterns?
Candlestick patterns are one of the oldest and most widely used tools in technical analysis. Originating in 18th-century Japan, where rice traders used them to track market prices, candlestick charts have become the default charting method for modern traders across stocks, forex, crypto, and commodities.
Each candlestick represents price activity over a specific time period. The body of the candle shows the distance between the open and close, while the wicks (also called shadows) show the high and low extremes reached during that period. A bullish candle closes higher than it opens, while a bearish candle closes lower.
What makes candlestick patterns so powerful is their ability to encode market sentiment into a single visual element. By studying these patterns, traders can identify potential reversals, continuations, and moments of indecision before they fully play out on the chart.
Anatomy of a Candlestick
Before diving into specific patterns, you need to understand the four data points that create every candlestick: open, high, low, and close (often abbreviated OHLC).
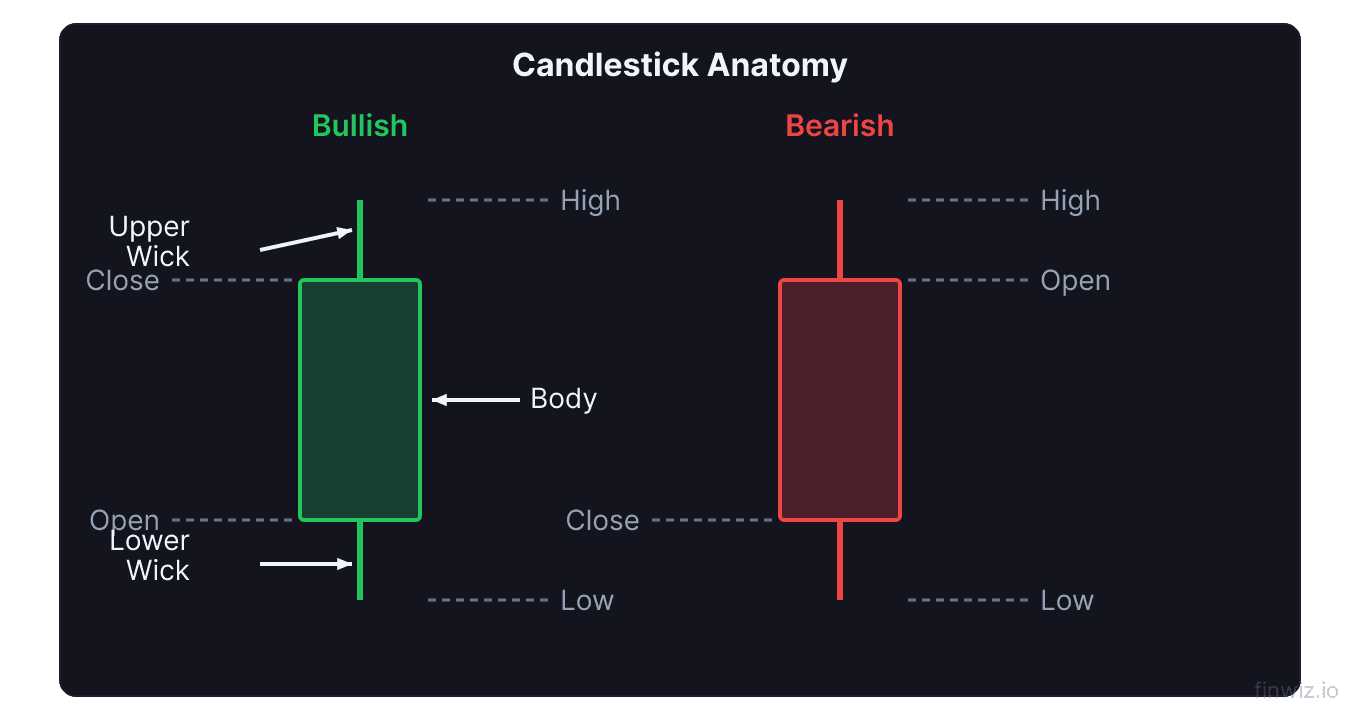
The real body is the thick portion of the candle. When the close is above the open, the body is typically colored green or white, indicating bullish price action. When the close is below the open, the body is red or black, signaling bearish activity.
The upper wick (or upper shadow) extends from the top of the body to the session high. The lower wick extends from the bottom of the body to the session low. Long wicks indicate that prices were pushed to extremes but ultimately rejected, which reveals important information about buying and selling pressure.
Pro Tip
Bullish Single-Candle Patterns
Single-candle patterns are the simplest formations to identify. They consist of just one candle and can signal shifts in momentum when they appear at critical price levels.
Hammer
The hammer features a small real body at the top of the trading range with a long lower wick at least twice the length of the body. It appears during a downtrend and signals that sellers pushed prices significantly lower, but buyers stepped in and drove the price back up near the open.
Bullish Marubozu
A bullish marubozu is a long green candle with little to no upper or lower wick. It indicates overwhelming buying pressure from open to close, with buyers in complete control the entire session. This pattern is most significant when it appears after a period of consolidation or at a support level.
Dragonfly Doji
The dragonfly doji has the open and close at or near the session high, with a long lower shadow. Like the hammer, it shows that sellers initially pushed prices down, but buyers reclaimed all lost ground by the close. It signals bullish reversal potential, especially at support.
Inverted Hammer
The inverted hammer has a small body near the low of the session with a long upper wick. Appearing during downtrends, it suggests early buying interest. While less reliable than the standard hammer, confirmation on the following candle strengthens the signal.
Bearish Single-Candle Patterns
These patterns warn of potential downside when they form during uptrends or at resistance levels.
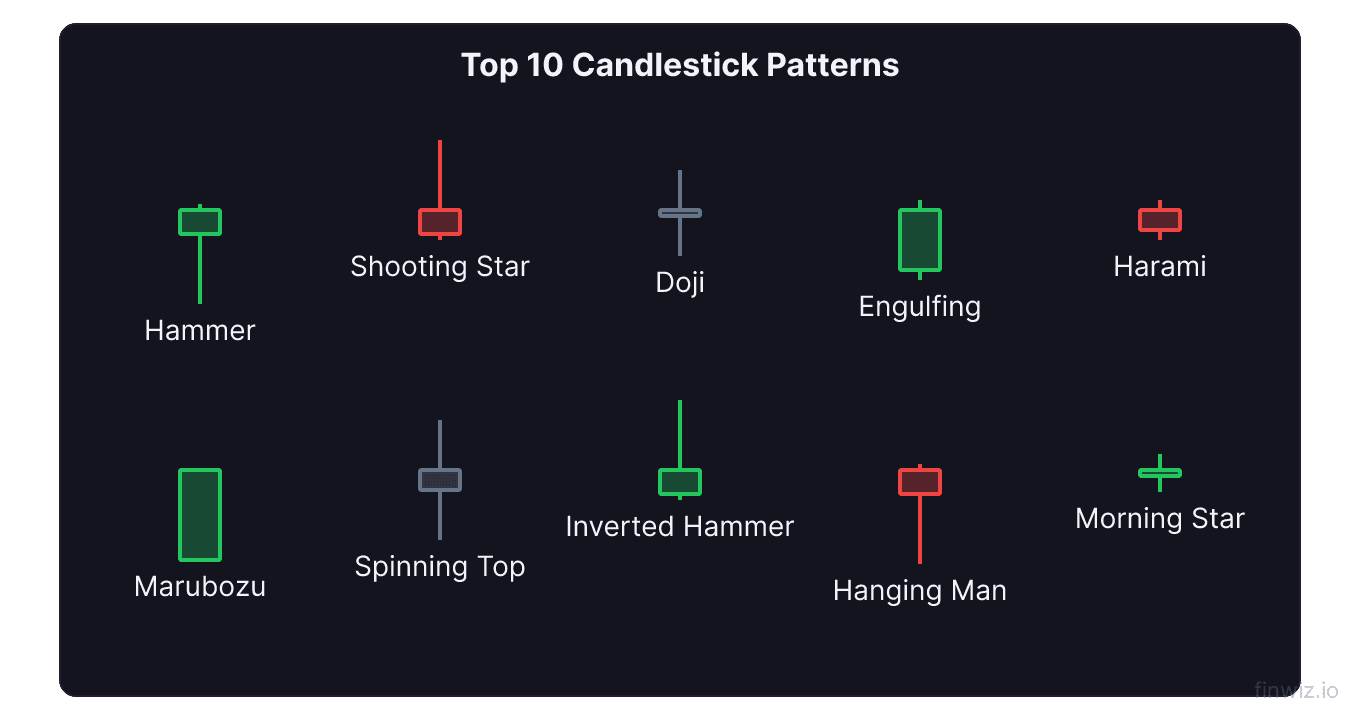
Shooting Star
The shooting star is the bearish counterpart to the hammer. It has a small body near the low of the session and a long upper wick. It appears during uptrends and shows that buyers pushed prices higher but were overwhelmed by sellers before the close.
Bearish Marubozu
A bearish marubozu is a long red candle with minimal or no wicks. It signals total seller dominance and is particularly bearish when it breaks through a support level or occurs on high volume.
Hanging Man
The hanging man looks identical to the hammer but appears during an uptrend. Despite closing near the highs, the long lower shadow reveals that sellers tested significantly lower prices during the session, hinting at weakening bullish momentum.
Gravestone Doji
The gravestone doji is the bearish counterpart to the dragonfly doji. The open and close sit near the session low, with a long upper wick showing that buyers attempted to push higher but were completely rejected.
Neutral and Indecision Patterns
Not every candle signals a clear direction. Some patterns reflect equilibrium between buyers and sellers.
Standard Doji
The doji forms when the open and close are nearly identical, creating a cross-like shape. It represents indecision and is most meaningful after a strong trend, where it can precede a reversal. Alone, a doji is neutral; context determines its significance.
Long-Legged Doji
A long-legged doji has exceptionally long upper and lower wicks with a tiny body in the middle. It shows extreme volatility and indecision, as both buyers and sellers pushed prices aggressively but neither maintained control.
Spinning Top
The spinning top has a small body with upper and lower wicks of roughly equal length. Similar to the doji, it indicates indecision, though the slightly larger body shows marginally more conviction than a true doji. Multiple spinning tops in succession suggest a market losing direction.
Pro Tip
Bullish Multi-Candle Reversal Patterns
Multi-candle patterns provide stronger signals because they show a developing shift in market sentiment over multiple trading sessions.
Bullish Engulfing
The bullish engulfing is a two-candle pattern. A small bearish candle is followed by a larger bullish candle whose body completely engulfs the prior candle's body. This shows buyers overpowering sellers and is most effective at support levels or after a sustained downtrend.
Morning Star
The morning star is a three-candle pattern that signals the end of a downtrend. It consists of a long bearish candle, followed by a small-bodied candle (the star) that gaps down, followed by a long bullish candle that closes above the midpoint of the first candle. Volume should increase on the third candle.
Three White Soldiers
Three white soldiers consist of three consecutive long-bodied bullish candles, each opening within the prior candle's body and closing near its high. This pattern signals strong, sustained buying pressure and often marks the beginning of a powerful uptrend, especially when appearing after a period of consolidation.
Piercing Line
The piercing line is a two-candle bullish reversal pattern. A long bearish candle is followed by a bullish candle that opens below the prior close but closes above the midpoint of the first candle's body. The deeper the penetration into the first candle's body, the stronger the signal.
Tweezer Bottom
A tweezer bottom forms when two consecutive candles share the same or very similar lows. The first candle is bearish and the second is bullish. The matching lows create a double support level, suggesting that sellers were unable to push prices any lower.
Bearish Multi-Candle Reversal Patterns
These patterns form during uptrends and warn of potential downside reversals.
Bearish Engulfing
The bearish engulfing mirrors the bullish version. A small bullish candle is followed by a larger bearish candle that completely engulfs the prior candle's body. It signals that sellers have overtaken buyers and is most reliable at resistance levels.
Evening Star
The evening star is a three-candle bearish reversal. A long bullish candle is followed by a small-bodied candle that gaps up (the star), followed by a long bearish candle that closes below the midpoint of the first candle. Rising volume on the third candle strengthens the signal.
Three Black Crows
Three black crows are three consecutive long-bodied bearish candles, each opening within the prior candle's body and closing near its low. This pattern signals aggressive, sustained selling and often marks the beginning of a significant downtrend.
Dark Cloud Cover
The dark cloud cover is a two-candle bearish reversal. A long bullish candle is followed by a bearish candle that opens above the prior high but closes below the midpoint of the first candle's body. It suggests that buyers are losing momentum.
Tweezer Top
A tweezer top features two candles with matching or near-matching highs. The first is bullish and the second is bearish. The equal highs establish a resistance ceiling, indicating that buyers cannot push past that price level.
Continuation Patterns
Not all candlestick patterns signal reversals. Some indicate that the existing trend is likely to continue.
Rising Three Methods
The rising three methods is a five-candle bullish continuation pattern. A long bullish candle is followed by three small-bodied bearish candles that stay within the range of the first candle, then another long bullish candle that closes above the first candle's high. It shows a brief pause in an uptrend before the advance resumes.
Falling Three Methods
The falling three methods is the bearish counterpart. A long bearish candle is followed by three small bullish candles within the first candle's range, then another long bearish candle closing below the first candle's low. It signals a temporary pullback within an ongoing downtrend.
| Pattern | Type | Signal | Reliability |
|---|---|---|---|
| Hammer | Single | Bullish Reversal | Moderate |
| Shooting Star | Single | Bearish Reversal | Moderate |
| Doji | Single | Indecision | Low (needs context) |
| Bullish Engulfing | Double | Bullish Reversal | High |
| Bearish Engulfing | Double | Bearish Reversal | High |
| Morning Star | Triple | Bullish Reversal | High |
| Evening Star | Triple | Bearish Reversal | High |
| Three White Soldiers | Triple | Bullish Continuation | High |
| Three Black Crows | Triple | Bearish Continuation | High |
How to Trade Candlestick Patterns
Identifying a pattern is only the first step. Successful trading requires context, confirmation, and disciplined risk management.
Step 1: Identify the trend. Candlestick patterns gain meaning from the trend they appear in. A hammer at the bottom of a downtrend is a reversal signal; the same shape mid-range is likely noise. Use moving averages to define the prevailing trend.
Step 2: Locate key levels. Patterns that form at significant support and resistance levels carry far more weight than those appearing in open space on the chart. The confluence of a pattern and a key level dramatically increases the probability of a successful trade.
Step 3: Confirm with volume. Volume should support the pattern's signal. A bullish engulfing on high volume is far more convincing than one on thin volume. Volume confirms that real participation is behind the price move.
Step 4: Wait for confirmation. Many traders wait for the next candle to confirm the pattern's signal before entering. For bullish patterns, this means waiting for a higher close. For bearish patterns, a lower close. This reduces false signals but may sacrifice some profit potential.
Step 5: Set your stop loss. Place stops beyond the pattern's extreme. For a hammer, the stop goes below the lower wick. For a shooting star, it goes above the upper wick. This defines your risk precisely.
Pro Tip
Common Mistakes with Candlestick Patterns
Even experienced traders fall into traps when using candlestick patterns. Here are the most frequent errors.
Trading patterns in isolation. A single candlestick pattern should never be your sole reason for entering a trade. Always seek confirmation from volume, indicators like MACD, and the broader market context.
Ignoring the timeframe. Patterns on a 1-minute chart are far less reliable than those on a daily or weekly chart. Higher timeframes carry more significance because they represent more participants and larger capital flows.
Forcing patterns. Not every candle forms a recognizable pattern. Traders who see patterns everywhere will inevitably take low-probability trades. Be selective and only act on clear, well-formed patterns at meaningful levels.
Neglecting risk management. No pattern works 100% of the time. Even the most reliable formations fail regularly. Always define your risk before entering, use proper position sizing, and never risk more than you can afford to lose.
Candlestick Patterns Across Different Markets
Candlestick patterns appear in every traded market, but their reliability can vary.
Stocks tend to produce the cleanest candlestick patterns because of regular trading hours that create true open and close prices. Gaps between sessions add meaning to gap-based patterns like the morning star and evening star.
Forex markets trade 24 hours during the week, so gap-based patterns are rare except over weekends. However, single-candle and multi-candle patterns still work well, especially on the 4-hour and daily timeframes.
Cryptocurrency markets are open 24/7, eliminating gaps entirely. Candlestick patterns remain useful in crypto, but the extreme volatility means wider stops are often needed, and false signals are more common.
Futures markets produce excellent candlestick patterns, particularly around settlement times and major economic releases. Volume data in futures is especially reliable, making volume-confirmed patterns particularly powerful.
Building a Candlestick Trading System
Rather than trading every pattern you see, build a systematic approach to candlestick analysis.
Start by selecting 3-5 patterns that suit your trading style and timeframe. Master those patterns completely before expanding your repertoire. Day traders might focus on dojis, engulfing patterns, and hammers on 5-minute charts, while swing traders might prefer morning stars, evening stars, and three white soldiers on the daily chart.
Create a checklist for every potential trade. Your checklist should include: pattern identification, trend context, support or resistance level, volume confirmation, indicator alignment, and risk-reward ratio. Only trade when the majority of your checklist items are satisfied.
Keep a trading journal that records every candlestick-based trade, including the pattern, context, entry, exit, and outcome. Over time, you will discover which patterns work best for your specific market, timeframe, and style.
Frequently Asked Questions
Which candlestick pattern is the most reliable?
No single candlestick pattern is universally the most reliable. However, research consistently shows that multi-candle patterns like the bullish and bearish engulfing, morning star, and evening star tend to produce higher win rates than single-candle patterns. The key factor is context: any pattern becomes significantly more reliable when it appears at a major support or resistance level with confirming volume and indicator alignment. The three white soldiers and three black crows patterns also rank among the most dependable because they show sustained momentum over three sessions.
Do candlestick patterns work on all timeframes?
Candlestick patterns appear on all timeframes, from 1-minute charts to monthly charts. However, higher timeframes generally produce more reliable signals. Daily and weekly charts reflect broader market sentiment and involve more market participants, reducing the noise that plagues lower timeframes. If you trade lower timeframes like the 5-minute or 15-minute chart, consider using higher-timeframe patterns as directional filters and only taking lower-timeframe setups that align with those larger signals.
How many candlestick patterns should I learn?
Start with 5-10 of the most common patterns: hammer, shooting star, doji, bullish engulfing, bearish engulfing, morning star, evening star, and three white soldiers or three black crows. Master these before moving on to more obscure formations. Most professional traders rely on a handful of patterns they know intimately rather than trying to trade dozens of formations they only partially understand. Quality of pattern recognition matters far more than quantity.
Can I use candlestick patterns alone without other indicators?
While candlestick patterns provide valuable information, using them in complete isolation is not recommended. At minimum, combine them with support and resistance analysis and volume. Adding one or two complementary indicators like the RSI or moving averages significantly improves your win rate. Candlestick patterns excel as a timing tool within a broader technical framework rather than as a standalone trading system.
What is the difference between a doji and a spinning top?
Both the doji and spinning top signal indecision, but they differ in the size of their real bodies. A doji has virtually no real body, with the open and close at nearly the same price. A spinning top has a small but visible real body, indicating slightly more directional bias than a doji. In practice, both patterns serve similar functions and are most meaningful when they appear after a strong trending move, suggesting that the dominant side is losing conviction.
Disclaimer
This is educational content, not financial advice. Trading involves risk, and you should consult a qualified financial advisor before making any investment decisions. Past performance does not guarantee future results.
Related Articles
12 chapters covering charts, indicators, risk management & more. Plus weekly trading insights.