Ascending Triangle Pattern: Bullish Breakout Setup
⚡ Key Takeaways
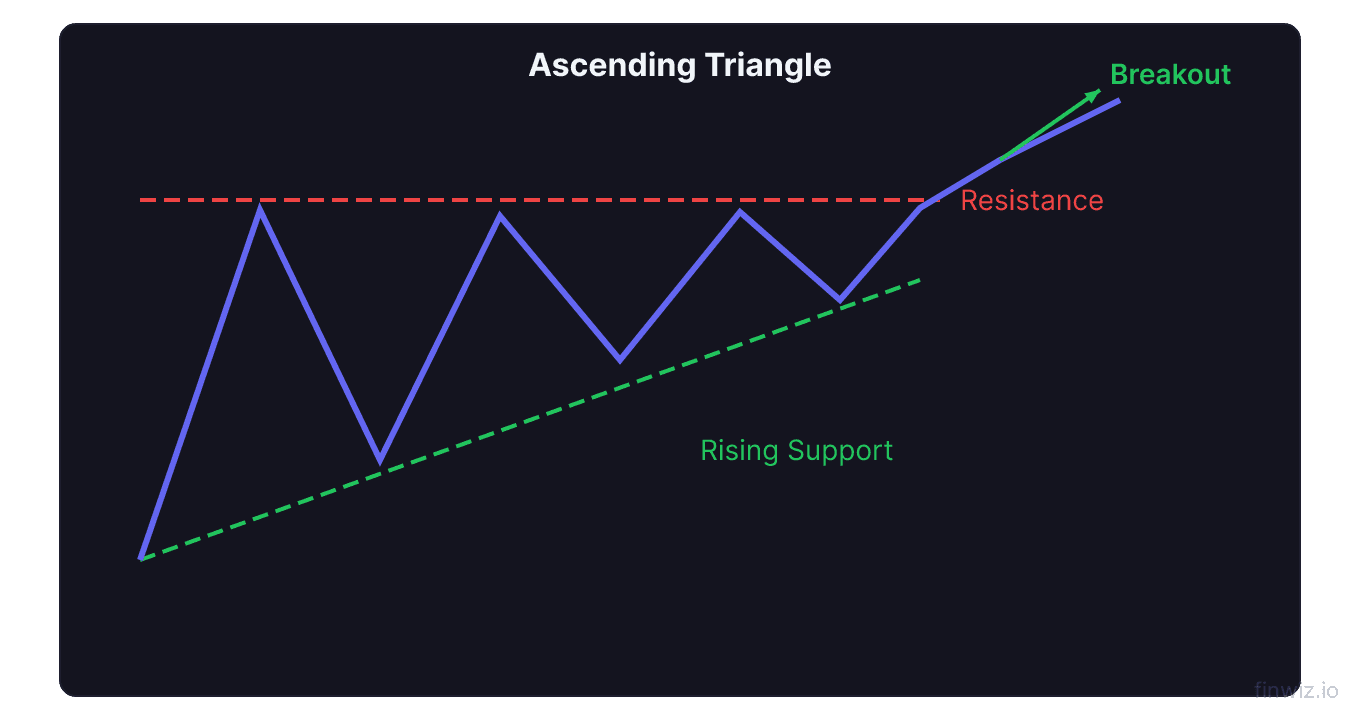
- The ascending triangle is a bullish chart pattern characterized by a flat upper resistance line and a rising lower trendline of higher lows.
- Each test of the flat resistance level weakens it, while the rising lows show increasing buying pressure that eventually leads to a breakout.
- Volume typically contracts during the pattern formation and expands significantly on the breakout above resistance.
- The measured move target equals the height of the triangle at its widest point, added to the breakout price.
- Ascending triangles can appear as continuation patterns within uptrends or occasionally as reversal patterns at market bottoms.
What Is an Ascending Triangle?
The ascending triangle is a bullish chart pattern that forms when price consolidates between a flat horizontal resistance level and a rising lower trendline. Each successive low is higher than the previous one, indicating that buyers are willing to step in at progressively higher prices, while sellers defend the same resistance level.
This pattern is one of the most reliable formations in technical analysis because it visually demonstrates the building pressure of demand against a fixed supply zone. Like a dam holding back rising water, the flat resistance level can only hold for so long before the mounting buying pressure forces a breakout.
The ascending triangle most commonly appears as a continuation pattern within an existing uptrend, but it can also occur as a reversal pattern at market lows. Regardless of context, the bullish bias comes from the structure itself: higher lows show buyers gaining ground with each pullback.
Structure of the Ascending Triangle
Understanding the components of this pattern is essential for accurate identification.
Flat Resistance Line
The flat resistance line is drawn across two or more roughly equal highs. Each time price rallies to this level, sellers step in and push it back down. However, the fact that price keeps returning to this level means buyers are persistent and supply at resistance is being absorbed with each test.
Ideally, the resistance line should be tested at least two to three times. Each test weakens the resistance level because it represents another round of selling that depletes the available supply. The more times resistance is tested, the more likely it is to eventually break.
Rising Lower Trendline
The rising lower trendline connects the series of higher lows that form as price bounces off the ascending support level. Each higher low demonstrates that buyers are becoming more aggressive, unwilling to wait for the previous low to re-enter the market.
Draw this trendline across at least two higher lows. The angle of ascent provides information about buying urgency: a steep trendline suggests aggressive demand, while a shallow angle indicates more patient accumulation.
The Apex
The point where the resistance line and the rising trendline would converge is called the apex. Price typically breaks out of the pattern before reaching the apex, usually within the final one-third of the pattern. Breakouts that occur too early (in the first third) may lack sufficient consolidation, while breakouts too close to the apex often lack the momentum for a significant move.
Pro Tip
Volume Characteristics
Volume behavior within the ascending triangle provides crucial confirmation signals.
During the pattern's formation, volume should generally contract. Each swing within the triangle shows lower volume than the previous swing, creating a pattern of declining activity. This contraction represents a tightening of the supply-demand balance and often precedes an explosive breakout.
On the breakout itself, volume should expand significantly. A breakout above resistance on volume that is at least 50% above the recent average provides strong confirmation. The surge in volume shows that buyers are flooding into the market as the resistance level falls, driving prices higher with conviction.
If the breakout occurs on low volume, treat it with caution. Low-volume breakouts frequently fail and reverse back into the pattern, trapping buyers at higher prices. Wait for volume confirmation before committing capital.
Trading the Ascending Triangle
The pattern provides clear levels for entry, stop loss, and price target.
Entry Strategies
Breakout entry: Buy when price closes above the flat resistance level on strong volume. This is the most common and straightforward approach. Wait for a full candle close above resistance rather than entering on an intraday breach.
Anticipation entry: Buy near the rising trendline as price bounces off support within the triangle. Place a tight stop below the trendline. This approach offers better prices but risks the pattern failing before reaching the breakout.
Retest entry: After a valid breakout, price sometimes pulls back to test the broken resistance as new support. Buying on this retest provides a high-probability entry with a tight stop just below the former resistance level.
Stop Loss
For breakout entries, place the stop below the most recent higher low within the triangle. This level represents the point where the pattern of higher lows would be broken, invalidating the bullish setup.
For anticipation entries near the trendline, place the stop just below the trendline. A break below the rising trendline signals that the ascending triangle is failing.
Price Target
Price Target = Breakout Price + Triangle HeightMeasure the height of the triangle at its widest point (from the flat resistance to the lowest point of the pattern). Add this distance to the breakout price. This gives the minimum expected advance.
| Entry Type | Price | Stop | Target | Risk-Reward |
|---|---|---|---|---|
| Breakout | At resistance break | Below last higher low | Height added to breakout | Moderate |
| Anticipation | At rising trendline | Below trendline | Height added to breakout | High |
| Retest | At former resistance | Below resistance | Height added to breakout | High |
Ascending Triangle vs. Other Triangle Patterns
The ascending triangle is one of three main triangle patterns, each with different implications.
The symmetrical triangle has both a descending upper trendline and a rising lower trendline, creating a neutral pattern that can break in either direction. Unlike the ascending triangle's bullish bias, the symmetrical triangle requires a breakout direction to determine the trade.
The descending triangle is the bearish counterpart to the ascending triangle. It features a flat support level and a descending upper trendline of lower highs. The descending triangle signals that sellers are becoming more aggressive while buyers defend a fixed price floor that will eventually break.
Understanding the differences helps you assess the probability of breakout direction. The ascending triangle's higher lows give it a clear bullish edge, while the symmetrical triangle's even pressure makes direction uncertain until the breakout.
Failed Ascending Triangles
While ascending triangles have a bullish bias, they can fail and break downward through the rising trendline.
A failed ascending triangle occurs when price breaks below the rising lower trendline instead of breaking above resistance. This failure is often driven by a sudden shift in market sentiment, negative news, or broader market weakness. Failed ascending triangles can produce sharp declines because they trap the buyers who accumulated positions during the pattern formation.
Warning signs of a potential failure include declining RSI readings during the pattern formation, the broader market showing weakness, and the stock's fundamentals deteriorating. If the stock breaks below the rising trendline on heavy volume, exit long positions immediately and consider a short trade targeting the bottom of the triangle.
Pro Tip
Ascending Triangle in Different Timeframes
Ascending triangles appear on all timeframes, but their reliability and implications vary.
On daily and weekly charts, ascending triangles are highly reliable and produce significant breakout moves. These patterns represent weeks to months of consolidation, involving large numbers of market participants and substantial capital flows. Breakouts from these patterns often lead to sustained trends.
On intraday charts (5-minute, 15-minute, 1-hour), ascending triangles form more frequently but are less reliable. They can be useful for day trading entries, particularly during the first two hours of the session when volume is highest. Use tighter stops and smaller targets for intraday ascending triangles.
On monthly charts, ascending triangles that span years can signal the beginning of major long-term bull moves. These rare but powerful patterns produce some of the largest breakouts in the market.
Combining with Other Analysis
Strengthen your ascending triangle analysis with complementary tools.
Moving averages: The best ascending triangle breakouts occur when the 50-day moving average is rising and positioned within the triangle, providing dynamic support that reinforces the pattern's higher lows. A breakout that also pushes price above a flat or declining 200-day moving average creates a powerful dual breakout.
RSI: Rising RSI values during the pattern formation confirm building bullish momentum. RSI values in the 50-60 range within the triangle are ideal; they show positive momentum without being overbought.
Relative strength: Compare the stock's performance to the broader market or its sector. A stock forming an ascending triangle while outperforming its peers is more likely to produce a successful breakout.
Fundamental catalysts: Ascending triangles that form ahead of known catalysts like earnings reports, product launches, or FDA decisions can produce especially explosive breakouts when the catalyst aligns with the technical setup.
Real-World Tips for Ascending Triangles
Experience teaches lessons that textbooks often miss.
Not all triangles are equal. An ascending triangle in a stock with strong fundamentals, institutional buying, and sector tailwinds is far more likely to break out successfully than one in a declining business. Always consider the underlying story.
Watch for false breakouts. Price may briefly pop above resistance before reversing back into the triangle. Using a close-based confirmation (rather than an intraday breach) significantly reduces false breakout risk. Some traders require price to close above resistance for two consecutive sessions before entering.
Be patient. Ascending triangles can take weeks or months to form. Entering too early means sitting through volatility within the triangle that tests your conviction. Waiting for the breakout requires patience but provides a higher-probability entry.
The ascending triangle remains one of the most trader-friendly patterns because of its clear structure, well-defined risk levels, and measurable profit targets. Mastering this formation gives you a reliable tool for identifying bullish opportunities across all markets and timeframes.
Frequently Asked Questions
How reliable is the ascending triangle as a bullish pattern?
The ascending triangle has a historical breakout rate to the upside of approximately 70-75%, making it one of the more reliable bullish patterns. However, this statistic varies based on market conditions, timeframe, and the quality of the pattern. In strong bull markets, the upside breakout rate may be even higher, while in bearish or choppy markets, failures increase. Proper volume confirmation on the breakout significantly improves reliability. The pattern's reliability also increases with the number of touches on both the resistance line and the rising trendline.
How long does an ascending triangle typically take to form?
On a daily chart, ascending triangles typically take 3 weeks to 3 months to form. Patterns that take less than 2 weeks to form may lack sufficient consolidation for a reliable breakout. On weekly charts, the pattern can develop over several months to a year. The duration depends on the significance of the resistance level being tested and the pace of accumulation. Generally, longer-forming patterns produce more significant breakout moves because they represent more thorough consolidation of the prior advance.
Can an ascending triangle break downward?
Yes, despite its bullish bias, an ascending triangle can break downward through the rising trendline. This occurs roughly 25-30% of the time. Downward breaks are more likely when the broader market is declining, the stock has weakening fundamentals, or volume is increasing during declines within the triangle rather than contracting. A failed ascending triangle can produce a sharp decline as trapped buyers exit, so always use a stop loss even when the pattern appears textbook bullish.
What is the difference between an ascending triangle and a rising wedge?
An ascending triangle has a flat horizontal upper boundary and a rising lower trendline, creating a bullish pattern. A rising wedge has both trendlines rising, with the lower trendline rising more steeply than the upper trendline, creating converging upward-sloping lines. The key difference is that the ascending triangle is bullish while the rising wedge is bearish. The rising wedge shows diminishing momentum as highs rise more slowly than lows, while the ascending triangle shows building pressure against a fixed resistance level.
Disclaimer
This is educational content, not financial advice. Trading involves risk, and you should consult a qualified financial advisor before making any investment decisions. Past performance does not guarantee future results.
12 chapters covering charts, indicators, risk management & more. Plus weekly trading insights.