Harmonic Patterns: Gartley, Butterfly & Bat Explained
⚡ Key Takeaways
- Harmonic patterns use precise Fibonacci ratios to identify potential reversal zones (PRZ) where price is likely to change direction, offering defined entry, stop, and target levels.
- The four major harmonic patterns — Gartley, Butterfly, Bat, and Crab — each have unique Fibonacci ratio requirements that determine their structure and completion zones.
- All harmonic patterns share a five-point XABCD structure built on the foundational ABCD pattern, with the XA leg providing the initial framework.
- The Potential Reversal Zone (PRZ) is where multiple Fibonacci measurements converge, creating a high-probability zone for trade entries.
- Harmonic trading requires patience and precision — patterns must meet specific ratio tolerances, and trades should only be taken when the PRZ aligns with other technical confluence.
What Are Harmonic Patterns?
Harmonic patterns are advanced chart formations that use specific Fibonacci ratios to identify precise potential reversal points in the market. Unlike basic chart patterns that rely on visual shape recognition, harmonic patterns demand that price legs meet exact mathematical relationships derived from Fibonacci numbers.
The concept of harmonic trading was pioneered by H.M. Gartley in his 1935 book Profits in the Stock Market and later refined by Scott Carney, Larry Pesavento, and other practitioners. Carney, in particular, codified the specific Fibonacci ratios for each pattern and introduced the concept of the Potential Reversal Zone (PRZ).
The core philosophy behind harmonic trading is that markets move in repetitive, proportional cycles. These cycles produce geometric price structures that can be measured and predicted using Fibonacci mathematics. When a pattern completes at its projected PRZ, the convergence of multiple Fibonacci levels creates a high-probability reversal zone.
The Five-Point XABCD Structure
All major harmonic patterns share a five-point structure labeled X, A, B, C, and D. This structure represents four price legs.
The Four Legs
- XA leg: The initial impulse move that establishes the pattern's framework
- AB leg: The first retracement of XA
- BC leg: A retracement of AB, moving back toward the XA direction
- CD leg: The final leg that completes the pattern at point D (the PRZ)
The ABCD pattern forms the core of every harmonic structure. The XA leg simply adds a preceding framework that defines which specific harmonic pattern is forming.
Bullish vs. Bearish
Bullish harmonic patterns complete at a low (point D is a bottom), signaling a buy opportunity. Bearish harmonic patterns complete at a high (point D is a top), signaling a sell or short opportunity. Each pattern has both bullish and bearish versions — the Fibonacci ratios remain the same; only the direction reverses.
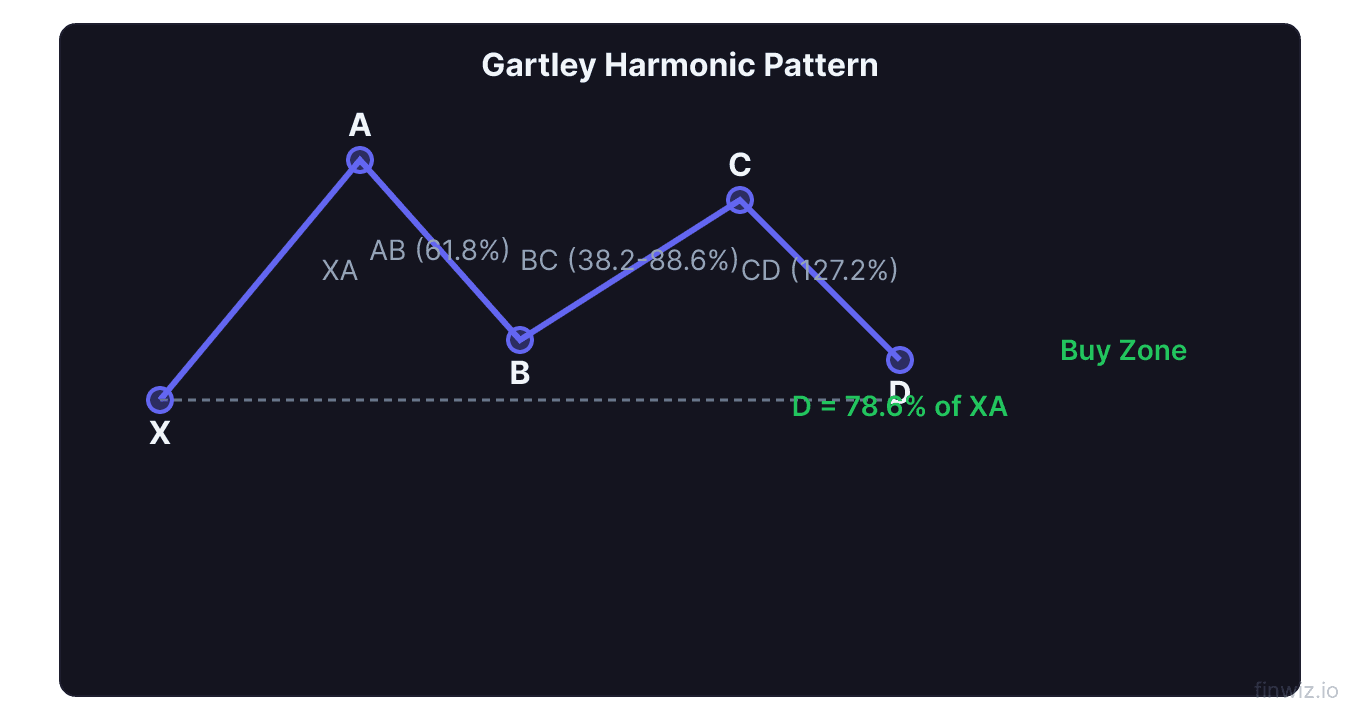
The Gartley Pattern (222)
The Gartley pattern is the original harmonic pattern, named after H.M. Gartley who described it in his book. It is sometimes called the "Gartley 222" after the page number on which it appeared.
Fibonacci Requirements
Gartley Pattern Ratios:The defining characteristic of the Gartley is that point D falls at the 0.786 retracement of the XA leg. This ratio is what distinguishes the Gartley from other harmonic patterns.
Trading the Gartley
The Gartley tends to produce moderate but reliable moves from the D point. It works best in markets that exhibit mean-reverting behavior rather than strong trending conditions.
| Component | Bullish Gartley | Bearish Gartley |
|---|---|---|
| Entry | Buy at D (0.786 of XA) | Sell at D (0.786 of XA) |
| Stop | Below X | Above X |
| Target 1 | 0.382 retracement of AD | 0.382 retracement of AD |
| Target 2 | Point C level | Point C level |
| Target 3 | 0.618 retracement of AD | 0.618 retracement of AD |
Pro Tip
The Butterfly Pattern
The Butterfly pattern, identified by Bryce Gilmore and refined by Scott Carney, is a harmonic pattern where point D extends beyond point X. This extension creates larger potential profit targets but also requires wider stop losses.
Fibonacci Requirements
Butterfly Pattern Ratios:The defining characteristic of the Butterfly is that point D extends to 1.272 or 1.618 of the XA leg, meaning price moves beyond the pattern's origin point.
Butterfly Characteristics
The Butterfly often appears at market extremes — at the end of extended moves where price pushes beyond a prior significant high or low before reversing. The extended D point means:
- Wider stop loss (stop goes beyond the X point)
- Larger profit potential (the reversal from the extension can be substantial)
- Fewer occurrences (the extension requirement filters out many setups)
The Butterfly is particularly effective at identifying false breakouts where price briefly exceeds a support or resistance level before reversing sharply.
The Bat Pattern
The Bat pattern, developed by Scott Carney in 2001, is distinguished by its deep D-point retracement at 0.886 of the XA leg.
Fibonacci Requirements
Bat Pattern Ratios:Bat Characteristics
The Bat pattern's 0.886 retracement at point D is deeper than the Gartley (0.786) but still stays within the XA range (unlike the Butterfly). Key features:
- Tight stop losses: Because D completes near but not beyond X, the stop can be placed just beyond X for tight risk control
- Excellent risk-reward: The tight stop combined with targets at the C and A levels typically produces 2:1 or better reward-to-risk ratios
- Moderate frequency: More common than the Butterfly but less common than the Gartley
Pro Tip
The Crab Pattern
The Crab pattern, also developed by Scott Carney, features the most extreme D-point extension of all the major harmonic patterns.
Fibonacci Requirements
Crab Pattern Ratios:Crab Characteristics
The Crab's D point at the 1.618 extension of XA represents the most extreme reversal zone among the major harmonics. Features include:
- Rare but powerful: The extreme extension means fewer valid patterns, but completions tend to produce dramatic reversals
- Wide stops: The stop must go beyond the 1.618 extension, requiring wider risk tolerance
- Large targets: The extreme extension creates potential for substantial retracement moves
The Crab is the pattern of choice for identifying major market turning points where price extends well beyond established levels before snapping back.
Comparing the Four Major Patterns
| Pattern | D-Point Location | AB Retracement | Stop Placement | Reliability | Frequency |
|---|---|---|---|---|---|
| Gartley | 0.786 of XA | 0.618 | Beyond X | Highest | Common |
| Bat | 0.886 of XA | 0.382-0.500 | Beyond X | High | Moderate |
| Butterfly | 1.272-1.618 of XA | 0.786 | Beyond D | Moderate | Less common |
| Crab | 1.618 of XA | 0.382-0.618 | Beyond D | Moderate | Rare |
The Potential Reversal Zone (PRZ)
The PRZ is the area where multiple Fibonacci measurements converge to define the expected reversal point. Rather than a single price, the PRZ is typically a zone spanning a few price points.
Constructing the PRZ
A complete PRZ includes:
- The D-point Fibonacci level (specific to the pattern type)
- The CD extension of BC (1.272, 1.618, 2.618, etc.)
- The AB = CD completion (where the CD leg equals AB in price distance)
- Additional Fibonacci levels from other swing points on the chart
When three or more of these measurements cluster in a tight zone, the PRZ is considered strong. When they are spread apart, the PRZ is weaker and the pattern is less reliable.
Confirming the PRZ
Watch for these confirmation signals as price enters the PRZ:
- Candlestick reversal patterns: Hammers, engulfing patterns, or dojis at the PRZ
- Volume spike: A sudden increase in volume at the PRZ signals institutional activity
- RSI divergence: RSI divergence at the PRZ adds a momentum-based confirmation layer
- Support/resistance confluence: PRZ aligning with a known support or resistance level
Scanning for Harmonic Patterns
Manual Identification
Identifying harmonic patterns manually requires practice and a systematic approach:
- Identify a clear XA impulse move
- Measure the AB retracement and check if it matches a pattern's ratio
- Wait for the BC leg to develop and check its retracement ratio
- Project the D point using the appropriate Fibonacci extensions
- Mark the PRZ zone on your chart and wait for price to arrive
Automated Scanners
Several tools can scan for harmonic patterns automatically:
- TradingView has community-built harmonic pattern indicators
- Harmonic Pattern Scanner add-ons exist for MetaTrader 4/5
- TrendSpider offers automated harmonic pattern recognition
- Dedicated software like Harmonic Trader provides comprehensive scanning
Automated scanners save significant time but should be verified manually before trading. False pattern identifications are common, especially in choppy markets.
Risk Management in Harmonic Trading
Universal Stop Loss Rule
For patterns where D is within the XA range (Gartley, Bat): place the stop beyond point X. If price reaches X, the entire XA framework has been violated and the pattern has failed.
For patterns where D extends beyond X (Butterfly, Crab): place the stop a defined distance beyond the D-point completion zone, typically using an ATR-based buffer.
Position Sizing
Calculate position size based on the distance between your entry (D point) and stop loss. Never risk more than 1-2% of your trading account on a single harmonic trade, regardless of how compelling the setup appears.
Scaling Out at Targets
A common harmonic exit strategy:
- Target 1 (0.382 AD retracement): Close 33% of the position — this is the most conservative target
- Target 2 (0.618 AD retracement): Close another 33% — captures the bulk of the move
- Target 3 (Point A or beyond): Trail the remaining 33% with a moving average stop
Common Harmonic Trading Mistakes
Approximate ratios. Harmonic patterns require precise Fibonacci measurements. A pattern where AB retraces 0.55 of XA does not qualify for either a Gartley (0.618) or Bat (0.382-0.500). Discipline with ratios is non-negotiable.
Ignoring the PRZ. Entering trades before price reaches the PRZ means trading an incomplete pattern. The edge comes from the confluence at the PRZ, not from the visual shape.
Skipping confirmation. Even when the PRZ is reached with perfect ratios, wait for a reversal candle or other confirmation before entering. The PRZ defines where to look, but confirmation tells you when to act.
Overleveraging. The precision of harmonic patterns can create false confidence. Maintain conservative position sizing regardless of pattern quality.
Frequently Asked Questions
Which harmonic pattern is the most reliable?
The Gartley pattern is generally considered the most reliable due to its conservative D-point placement at 0.786 of XA, which stays within the XA range. The Bat pattern is a close second with its tight stop placement relative to the D point. Reliability always improves with additional confluence.
Can harmonic patterns be used on any timeframe?
Yes, harmonic patterns form across all timeframes. 4-hour and daily charts offer the best balance of pattern clarity, reliability, and trade frequency. Higher timeframes produce fewer but more significant patterns. Intraday harmonic patterns require faster execution and tighter risk management.
How long does it take for a harmonic pattern to complete?
Completion time varies widely depending on timeframe and market conditions. On a daily chart, a harmonic pattern may take 2 to 6 weeks from X to D. On an hourly chart, completion may take days. Time symmetry between AB and CD can help estimate the completion timeline.
What happens if the D point is exceeded?
If price moves significantly beyond the projected D point without reversing, the pattern has failed. Execute your stop loss and move on. A failed harmonic at one Fibonacci level may set up a different pattern at a deeper level — for instance, a failed Gartley (0.786) may set up a Bat (0.886).
Can I combine harmonic patterns with other trading strategies?
Absolutely. Harmonic patterns are strengthened by combining them with support/resistance analysis, RSI divergence, Bollinger Band extremes, Wyckoff method analysis, and volume confirmation. Multi-factor confluence at the PRZ produces the highest-probability trades.
Do harmonic patterns work in all market conditions?
Harmonic patterns perform best in ranging and mean-reverting markets where price respects Fibonacci levels. In strongly trending markets, patterns frequently fail as price blows through the PRZ. Use the ADX to assess trend strength — avoid harmonic setups when ADX is above 40, indicating an extremely strong trend.
Disclaimer
This is educational content, not financial advice. Trading involves risk, and you should consult a qualified financial advisor before making any investment decisions. Past performance does not guarantee future results.
Related Articles
12 chapters covering charts, indicators, risk management & more. Plus weekly trading insights.