Wyckoff Method: Accumulation, Distribution & Market Phases
⚡ Key Takeaways
- The Wyckoff Method is a comprehensive approach to market analysis developed by Richard D. Wyckoff that identifies the accumulation and distribution activities of large institutional operators (the
- ).
- The four market phases — accumulation, markup, distribution, and markdown — form a complete cycle that repeats as institutional investors build and unload positions.
- Springs (false breakdowns below support) and upthrusts (false breakouts above resistance) are critical Wyckoff events that trap retail traders and signal imminent reversals.
- The Composite Man concept teaches traders to read the market as if a single powerful entity controls price action, using volume and price spread analysis to detect institutional intent.
- Wyckoff
What Is the Wyckoff Method?
The Wyckoff Method is a technical analysis framework developed by Richard Demille Wyckoff in the early 20th century. Rather than focusing on individual indicators or patterns, the Wyckoff Method provides a comprehensive approach to understanding how and why prices move by analyzing the behavior of large institutional operators.
Wyckoff's core insight was that markets are not random — they are driven by the deliberate activities of well-informed, well-capitalized traders and institutions. By studying the relationship between price action, volume, and time, individual traders can identify when these large operators are accumulating (buying) or distributing (selling), and position themselves accordingly.
The method remains remarkably relevant today. Despite being developed nearly a century ago, Wyckoff's principles accurately describe the dynamics of modern markets where institutional investors, hedge funds, and algorithmic trading systems move prices in predictable cycles.
The Composite Man Concept
Wyckoff introduced the idea of the Composite Man (also called the Composite Operator) as a mental model for understanding market behavior.
The Composite Man is an imaginary entity that represents the combined actions of all large, informed market participants. By imagining the market as being controlled by a single powerful operator, traders can better interpret price and volume behavior.
The Composite Man:
- Plans and executes campaigns to accumulate or distribute shares over time
- Manipulates price to create false impressions that mislead retail traders
- Uses volume strategically — absorbing supply during accumulation and offloading shares during distribution
- Creates springs and upthrusts to trap uninformed traders on the wrong side
Wyckoff's advice was simple: study the market as if a single entity controls it, and learn to detect that entity's intentions through price-volume analysis.
Pro Tip
Wyckoff's Three Laws
Wyckoff's analytical framework rests on three fundamental laws.
Law 1: Supply and Demand
The Law of Supply and Demand determines price direction. When demand (buying) exceeds supply (selling), prices rise. When supply exceeds demand, prices fall. When supply and demand are in balance, prices trade sideways.
This law seems obvious, but Wyckoff's innovation was in teaching traders to read supply and demand through price-volume behavior rather than relying on fundamental analysis or news.
Law 2: Cause and Effect
The Law of Cause and Effect states that every price move (effect) requires preparation (cause). The cause is the accumulation or distribution that occurs during trading ranges. The effect is the subsequent markup or markdown trend.
The duration and depth of the cause determines the magnitude of the effect. A stock that undergoes three months of accumulation will produce a larger advance than one with only two weeks of accumulation. This is similar to a spring being compressed — the more compression (cause), the greater the release (effect).
Wyckoff Point and Figure Count:Law 3: Effort vs. Result
The Law of Effort vs. Result compares volume (effort) to price movement (result). When effort and result are in harmony, the trend is likely to continue. When they diverge, a change may be imminent.
- High volume with large price spread: Effort matches result — trend is healthy
- High volume with small price spread: Heavy effort with little result — potential reversal or resistance
- Low volume with large price spread: Easy movement — low resistance in the trend direction
- Low volume with small price spread: No interest — consolidation
This law is directly applicable to analyzing individual candles, using concepts similar to candlestick analysis but with a specific volume interpretation framework.
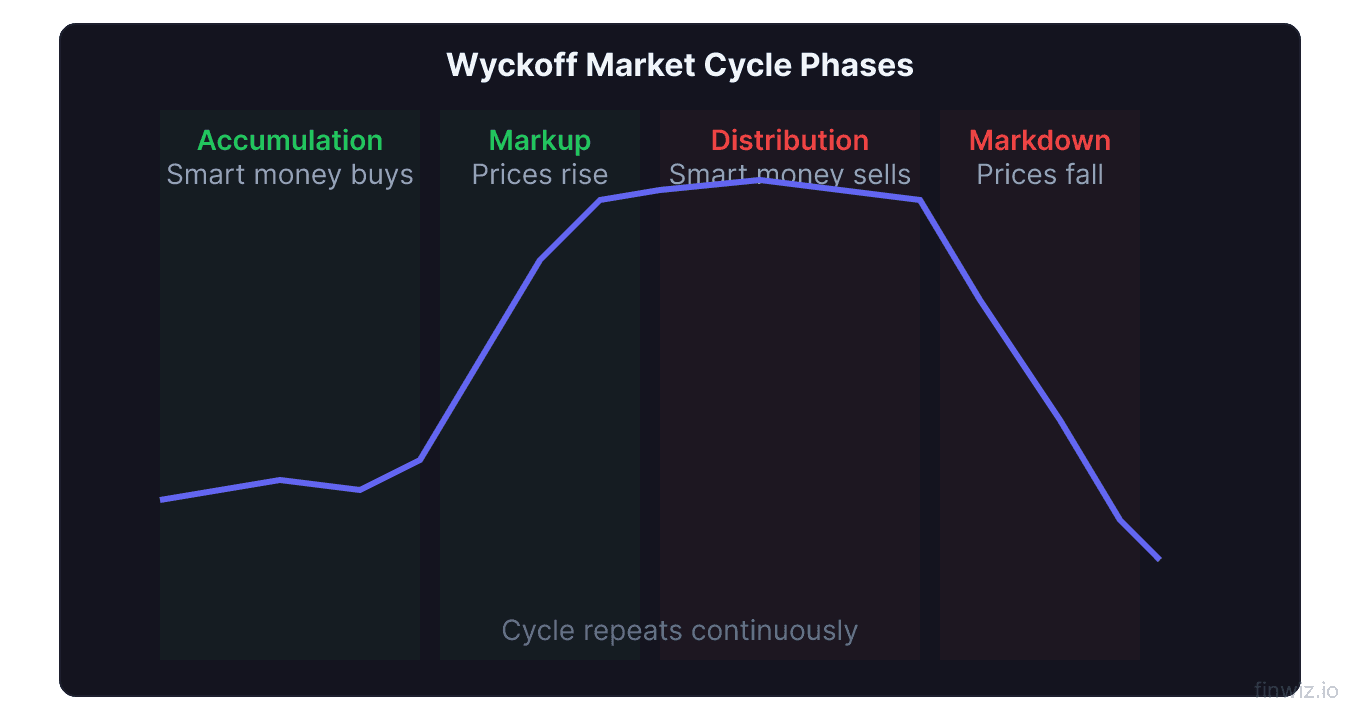
The Four Market Phases
Wyckoff identified four distinct phases that markets cycle through repeatedly.
Phase 1: Accumulation
Accumulation is the phase where informed buyers (the Composite Man) build positions at low prices. It occurs after a markdown (downtrend) when prices have reached levels that attract institutional buying.
During accumulation:
- Price trades in a horizontal range after a decline
- Volume is moderate to high as institutional buying absorbs selling from discouraged holders
- Multiple tests of support demonstrate that the range floor is holding
- The Accumulation/Distribution line begins trending upward
Phase 2: Markup
Markup is the uptrend phase that follows accumulation. Once the Composite Man has built a sufficient position, prices break out of the trading range and advance.
During markup:
- Price trends higher with higher highs and higher lows
- Volume increases on advances and decreases on pullbacks
- Moving averages align bullishly (20 > 50 > 200)
- Public participation gradually increases
Phase 3: Distribution
Distribution is the mirror of accumulation. Informed sellers (the Composite Man) unload positions at high prices to eager retail buyers.
During distribution:
- Price trades in a horizontal range after an advance
- Volume is heavy as institutional selling meets retail demand
- Multiple tests of resistance show that the range ceiling is holding
- Bearish divergences appear on indicators like RSI and MFI
Phase 4: Markdown
Markdown is the downtrend that follows distribution. Once institutions have unloaded their positions, the reduced demand causes prices to fall.
During markdown:
- Price trends lower with lower highs and lower lows
- Volume spikes on declines and fades on bounces
- Moving averages align bearishly
- Fear replaces greed in market sentiment
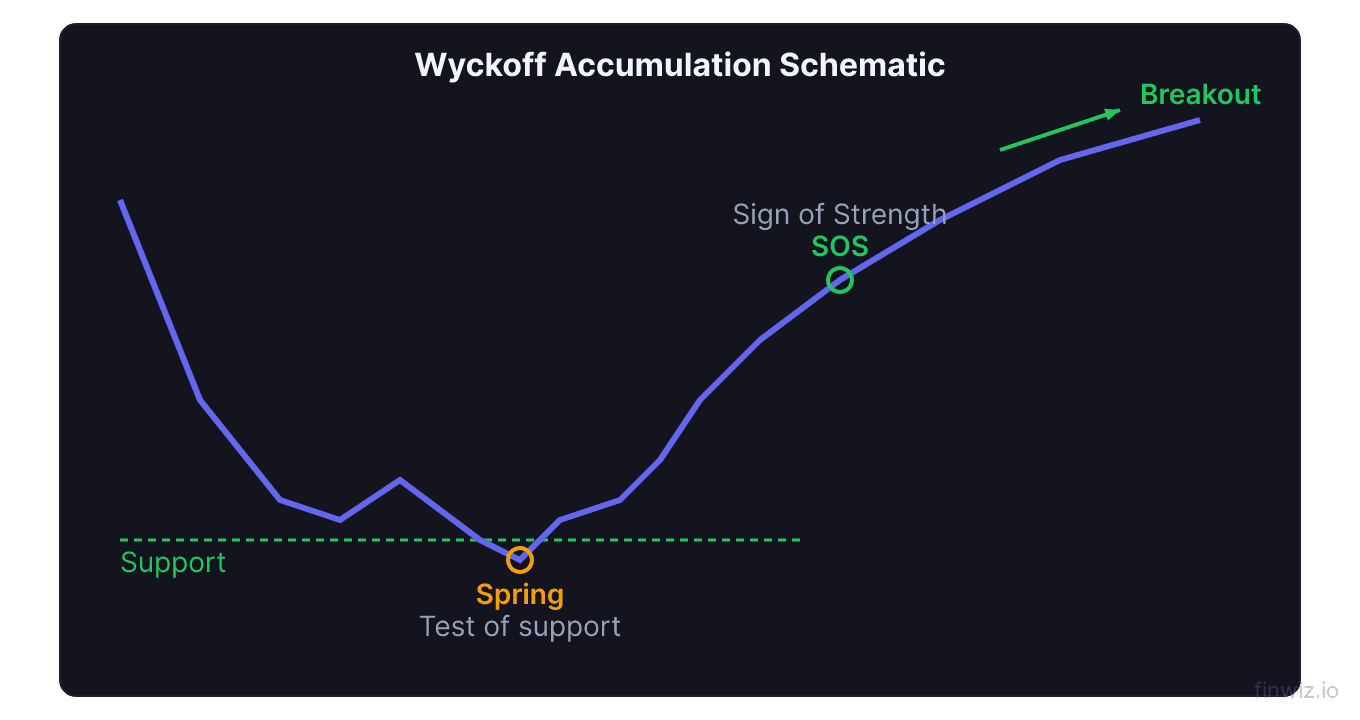
Wyckoff Accumulation Schematic
The accumulation phase follows a structured sequence of events. Wyckoff practitioners use a schematic with labeled phases to track the progression.
| Phase | Label | Event | Description |
|---|---|---|---|
| A | PS | Preliminary Support | First sign of buying interest after a decline |
| A | SC | Selling Climax | Panic selling on heavy volume; sharp decline ends |
| A | AR | Automatic Rally | Quick bounce from SC lows as selling exhausts |
| A | ST | Secondary Test | Price returns to SC area to test demand |
| B | - | Building the Cause | Extended range with multiple tests |
| C | Spring | Spring/Shakeout | False breakdown below support — traps sellers |
| C | Test | Test of Spring | Low-volume return to Spring low confirms demand |
| D | SOS | Sign of Strength | Breakout from range on expanding volume |
| D | LPS | Last Point of Support | Pullback to range top (now support) |
| E | - | Markup Phase | Sustained uptrend begins |
The Spring: Wyckoff's Key Event
The Spring is perhaps the most important event in Wyckoff analysis. It is a false breakdown below the accumulation range's support that traps short sellers and shakes out weak long holders before the markup begins.
The Spring works as follows:
- Price breaks below the range support, triggering stop losses and attracting new short sellers
- Volume may spike briefly on the breakdown
- Price quickly reverses back into the range, trapping the shorts
- The trapped shorts must cover (buy back), adding fuel to the subsequent advance
The Spring is the Composite Man's final act of manipulation — one last shake-out before initiating the markup phase.
Pro Tip
Wyckoff Distribution Schematic
Distribution is the inverse of accumulation, with its own set of labeled events.
| Phase | Label | Event | Description |
|---|---|---|---|
| A | PSY | Preliminary Supply | First sign of selling interest after advance |
| A | BC | Buying Climax | Euphoric buying on heavy volume; sharp high |
| A | AR | Automatic Reaction | Quick decline from BC highs as buying exhausts |
| A | ST | Secondary Test | Price returns to BC area to test supply |
| B | - | Building the Cause | Extended range with multiple tests |
| C | UT/UTAD | Upthrust | False breakout above resistance — traps buyers |
| D | SOW | Sign of Weakness | Breakdown from range on expanding volume |
| D | LPSY | Last Point of Supply | Rally to range bottom (now resistance) |
| E | - | Markdown Phase | Sustained downtrend begins |
The Upthrust: Distribution's Key Event
The Upthrust (also called Upthrust After Distribution, or UTAD) is the distribution-phase equivalent of the Spring. It is a false breakout above the distribution range's resistance that traps breakout buyers before the markdown begins.
The Upthrust:
- Price breaks above range resistance, triggering buy orders and attracting momentum traders
- Price quickly reverses back into the range
- Trapped buyers are now holding losses and will sell into rallies, adding supply
- The additional selling pressure fuels the subsequent markdown
Applying Wyckoff in Modern Markets
Volume Spread Analysis (VSA)
Modern practitioners use Volume Spread Analysis — studying the relationship between each bar's volume, price spread (high to low), and close location — to implement Wyckoff principles.
Key VSA signals:
- No demand bars: Narrow spread, low volume, close on or near the low — no buying interest, bearish
- No supply bars: Narrow spread, low volume, close on or near the high — no selling interest, bullish
- Stopping volume: High volume with a narrow spread at a support or resistance level — absorption by informed traders
- Climactic action: Very high volume with a wide spread — potential exhaustion and reversal
Using Modern Indicators with Wyckoff
While Wyckoff developed his method before most modern indicators existed, several complement his framework:
- OBV and A/D line: Confirm accumulation and distribution phases
- Volume Profile: Identifies high-volume nodes within trading ranges
- RSI divergence: Confirms effort vs. result dynamics at range boundaries
- VWAP: Identifies institutional average entry prices within ranges
Common Wyckoff Mistakes
Looking for the schematic too literally. Real markets rarely produce textbook-perfect Wyckoff schematics. The phases and events may occur in slightly different orders, with varying intensity. Focus on understanding the principles rather than matching every label.
Calling the Spring too early. Not every dip below support is a Spring. Wait for the quick recovery and low-volume test before concluding that a Spring has occurred.
Ignoring volume. Volume is the backbone of Wyckoff analysis. Without proper volume analysis, you are just looking at price patterns, which sacrifices the method's primary advantage.
Applying on too short a timeframe. Wyckoff's principles work best on daily and weekly charts where institutional behavior is most visible. Intraday application is possible but requires experience.
Frequently Asked Questions
Is the Wyckoff Method still relevant today?
Yes. The Wyckoff Method remains highly relevant because it is based on the universal dynamics of supply, demand, and institutional behavior — dynamics that have not changed despite technological advances. Modern institutional trading, while faster and more automated, still follows the same accumulation-distribution cycle Wyckoff identified.
How long does a Wyckoff accumulation phase last?
Accumulation phases vary widely — from weeks to months on daily charts. The duration depends on the security, market conditions, and the size of positions being accumulated. Larger institutional campaigns require more time. The Law of Cause and Effect suggests that longer accumulation phases lead to larger subsequent markups.
Can I use the Wyckoff Method for day trading?
Wyckoff principles can be applied to intraday trading, though the method was designed for higher timeframes. Intraday Wyckoff analysis focuses on range-based trading — identifying accumulation and distribution within the day's range, trading Springs and Upthrusts at intraday support/resistance levels.
How do I know if it is a Spring or a genuine breakdown?
The key differentiator is volume and follow-through. A Spring typically occurs on moderate volume and price quickly (within 1-3 sessions) recovers back into the range. A genuine breakdown occurs on high, climactic volume and price continues lower with no quick recovery. The Test of the Spring — a low-volume return to the Spring low that holds — confirms the Spring.
What is the difference between Wyckoff and Elliott Wave?
Wyckoff focuses on volume-price relationships and institutional behavior within trading ranges. Elliott Wave focuses on wave counting and Fibonacci ratios within trending moves. Wyckoff excels at identifying range-bound accumulation/distribution, while Elliott Wave excels at projecting trend targets. Some traders use both frameworks together.
How do I combine Wyckoff with the Accumulation/Distribution indicator?
The A/D line provides quantitative confirmation of Wyckoff's qualitative analysis. During a suspected accumulation phase, a rising A/D line confirms that money is flowing into the security. During suspected distribution, a declining A/D line confirms outflows. Use the A/D line as a validation tool for your Wyckoff phase identification.
Disclaimer
This is educational content, not financial advice. Trading involves risk, and you should consult a qualified financial advisor before making any investment decisions. Past performance does not guarantee future results.
Related Articles
12 chapters covering charts, indicators, risk management & more. Plus weekly trading insights.