TTM Squeeze: Detecting Explosive Breakouts Before They Happen
⚡ Key Takeaways
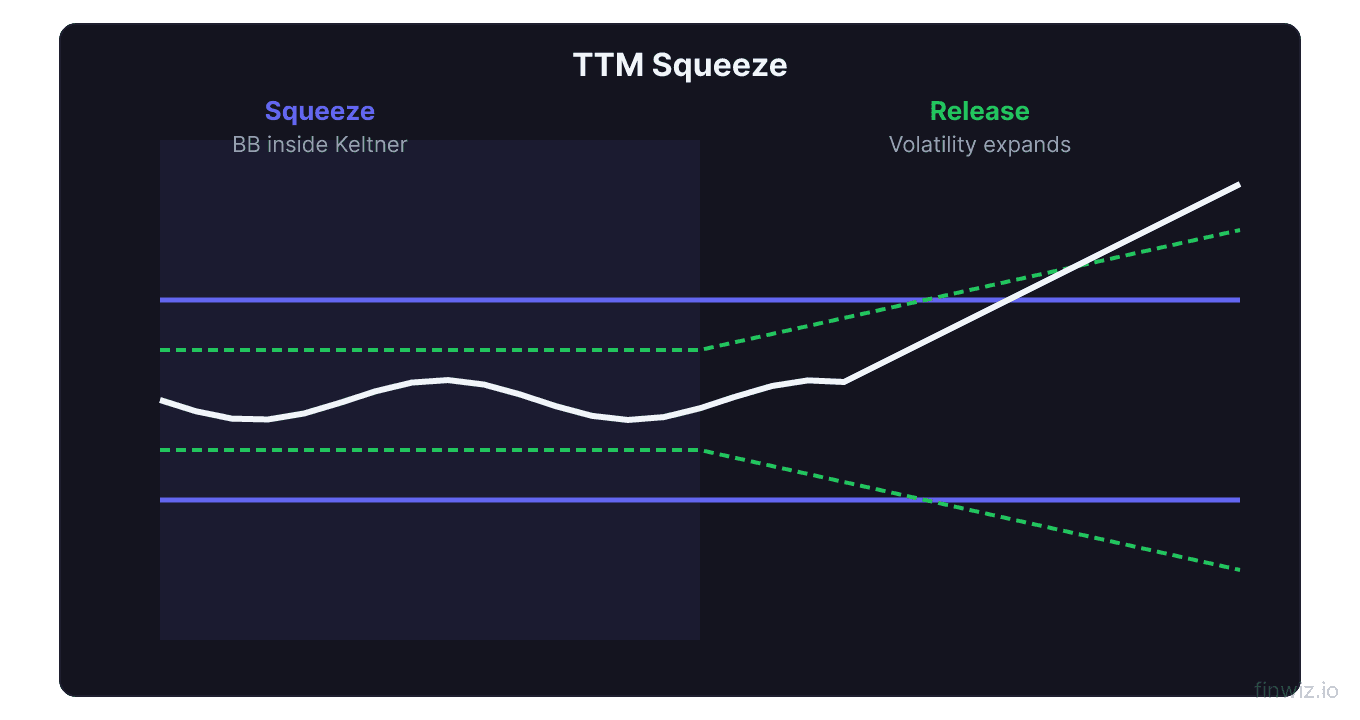
- The TTM Squeeze fires when Bollinger Bands move inside Keltner Channels, indicating a period of low volatility compression that typically precedes a significant price move
- "Squeeze on" (red dots) means Bollinger Bands are inside Keltner Channels and volatility is compressing; "squeeze off" (green dots) means Bollinger Bands have expanded outside Keltner Channels
- The momentum histogram determines the direction of the expected breakout: positive and rising histogram suggests a bullish breakout, negative and declining suggests bearish
- Developed by John Carter and described in his book "Mastering the Trade," the TTM Squeeze combines three indicators into one actionable setup
- The squeeze works best on daily and weekly charts for swing trading, though it can be applied to any timeframe
What Is the TTM Squeeze?
The TTM Squeeze is a volatility and momentum indicator developed by John Carter that identifies periods of low volatility compression followed by explosive directional moves. It works by detecting when Bollinger Bands contract inside Keltner Channels, a condition that signals the market is coiling for a significant breakout.
The concept is based on a well-established market principle: periods of low volatility are followed by periods of high volatility. When a stock trades in a tight range for an extended period, the eventual breakout tends to produce a large, directional move. The TTM Squeeze identifies these compression periods and uses a momentum oscillator to predict the direction of the breakout.
The "TTM" stands for "Trade the Markets," John Carter's trading education company. Carter introduced the indicator in his 2005 book "Mastering the Trade," and it has since become one of the most popular scanning and trading tools among active traders.
How the TTM Squeeze Works
The TTM Squeeze combines three components: Bollinger Bands for volatility measurement, Keltner Channels for volatility context, and a momentum oscillator for directional bias.
The Squeeze Condition
Bollinger Bands use standard deviation to create bands around a moving average. When volatility is low, the bands contract. When volatility is high, the bands expand.
Keltner Channels use the Average True Range (ATR) to create channels around a moving average. Keltner Channels are generally smoother and less reactive than Bollinger Bands.
The squeeze condition occurs when the Bollinger Bands move inside the Keltner Channels. This means that standard deviation-based volatility has contracted to such a degree that it falls within the ATR-based channel, indicating an unusually compressed price environment.
Bollinger Bands (default):The Squeeze Dots
On most charting platforms, the squeeze condition is displayed as colored dots on the zero line of the indicator:
- Red dots (Squeeze On): Bollinger Bands are inside Keltner Channels. Volatility is compressing. The market is coiling for a potential breakout.
- Green dots (Squeeze Off): Bollinger Bands have expanded outside Keltner Channels. The squeeze has fired, and a directional move is underway.
The transition from red dots to green dots is the key signal. This is when the squeeze "fires," and traders look to the momentum histogram to determine which direction to trade.
The Momentum Histogram
The TTM Squeeze's momentum component uses a modified version of the MACD or a linear regression-based momentum oscillator. Carter's original version uses a momentum oscillator calculated as the closing price relative to the midpoint of the highest high and lowest low combined with an exponential moving average.
The histogram appears as bars above or below the zero line:
- Positive bars (above zero): Bullish momentum
- Negative bars (below zero): Bearish momentum
- Rising bars (regardless of position): Momentum accelerating
- Declining bars (regardless of position): Momentum decelerating
Pro Tip
How to Trade the TTM Squeeze
The Classic John Carter Setup
Carter's method for trading the squeeze involves these steps:
1. Identify the squeeze. Scan for stocks showing red dots on the TTM Squeeze indicator. The longer the squeeze persists (more consecutive red dots), the more powerful the eventual breakout tends to be.
2. Determine direction. Look at the momentum histogram. If momentum is positive and rising, prepare for a long trade. If momentum is negative and declining, prepare for a short trade.
3. Wait for the fire. Enter the trade when the first green dot appears (squeeze fires off), confirming that volatility is expanding.
4. Manage the position. Hold the trade as long as the momentum histogram continues to increase (for longs) or decrease (for shorts). When the histogram begins to flatten or turn against your direction, consider tightening your stop or taking profits.
Entry and Exit Rules
Entry: Buy when the squeeze fires off (first green dot) and the momentum histogram is above zero and rising. Sell short when the squeeze fires off and the momentum histogram is below zero and declining.
Stop loss: Place your stop below the most recent swing low (for longs) or above the most recent swing high (for shorts). Some traders use a stop below the Keltner Channel lower band.
Profit target: Let the momentum histogram guide your exit. When the histogram reaches a peak and begins declining, the momentum phase is ending. Take partial or full profits when the histogram turns against your trade direction.
Scanning for TTM Squeeze Setups
Most modern trading platforms allow you to scan for squeeze conditions. Key scan criteria include:
- TTM Squeeze status = On (Bollinger inside Keltner)
- Consecutive squeeze bars greater than 6 (indicating extended compression)
- Momentum histogram direction (above or below zero)
- Daily volume above 500,000 shares (for liquidity)
- Price above $10 (to avoid penny stock noise)
The best squeeze setups often develop over 6 to 15 or more consecutive bars (red dots). Short squeezes of only 2-3 bars tend to produce smaller moves.
TTM Squeeze Across Timeframes
The TTM Squeeze works on any timeframe, but its character changes depending on the chart period.
| Timeframe | Squeeze Duration | Typical Breakout Size | Best For |
|---|---|---|---|
| 5-minute | 30-75 minutes | Quick scalps | Day trading |
| 15-minute | 1-4 hours | Intraday moves | Day trading |
| Daily | 1-3 weeks | Multi-day swings | Swing trading |
| Weekly | 1-3 months | Major trend moves | Position trading |
| Monthly | 3-12 months | Major bull/bear moves | Long-term investing |
Daily charts are the most popular timeframe for the TTM Squeeze. The squeeze typically lasts 6-15 trading days and produces swings of 5-15% on individual stocks.
Weekly charts produce fewer signals but identify larger moves. A weekly squeeze that fires off can signal the start of a multi-month trend.
Pro Tip
Combining TTM Squeeze with Other Indicators
The TTM Squeeze is most effective when combined with additional confirmation.
Volume Confirmation
A squeeze breakout accompanied by a surge in trading volume is more likely to sustain than one on average or below-average volume. Look for volume at least 50% above the 20-day average on the breakout bar.
Trend Direction Filter
Use a simple trend filter to trade only in the direction of the larger trend. If the stock is above its 200-day moving average, only take bullish squeeze setups. If below, only take bearish setups. This single filter eliminates many false signals.
RSI Positioning
Check RSI positioning when the squeeze fires. A bullish squeeze that fires with RSI between 40 and 60 offers more upside potential than one that fires with RSI already above 70. The RSI sweet spot for bullish squeeze entries is 45-60.
Support and Resistance Context
Squeeze breakouts near major support levels tend to produce strong bounces. Squeeze breakouts near major resistance levels can lead to powerful breakout-and-continuation moves. Understanding the price structure context helps you set realistic targets and appropriate stop levels.
When the TTM Squeeze Fails
Not every squeeze produces a clean, directional move. Here are the common failure modes.
False squeeze fires in choppy markets. In range-bound environments, the squeeze can fire off in one direction only to quickly reverse. The momentum histogram may briefly cross zero and then reverse, causing a whipsaw loss.
Low-volume breakouts. A squeeze that fires on declining volume often lacks the buying or selling conviction to sustain the move. The price may briefly break out and then fall back into the prior range.
Conflicting timeframes. A daily squeeze firing bullish while the weekly trend is clearly bearish often results in a failed breakout. The larger timeframe trend tends to reassert itself.
News-driven reversals. Earnings announcements, FDA decisions, or other binary events can override technical signals. If a squeeze fires off just before a major news event, the technical setup may be overwhelmed by the fundamental catalyst.
Real-World Example: NVIDIA 2023
NVIDIA (NVDA) provided a textbook TTM Squeeze setup in early 2023. After a significant decline in 2022, NVDA entered a multi-week squeeze on the daily chart in January 2023, with Bollinger Bands tightly compressed inside Keltner Channels.
The squeeze lasted approximately 12 trading days (12 consecutive red dots). The momentum histogram was building above zero throughout the squeeze, indicating bullish directional bias.
When the squeeze fired off in late January, NVDA broke out with strong volume ahead of its earnings report. The stock surged from approximately $195 to over $270 in the following weeks, a gain of nearly 40%.
This example demonstrates the TTM Squeeze at its best: extended compression, clear momentum direction, volume confirmation, and a powerful directional move.
TTM Squeeze Settings and Customization
While John Carter's original settings are the most common, some traders adjust the parameters.
Bollinger Band settings: The default 20-period, 2.0 standard deviation can be adjusted. Some traders use 1.5 standard deviations for a tighter squeeze trigger, which fires more frequently but catches smaller compressions.
Keltner Channel settings: The default 20-period, 1.5 ATR multiplier can be widened to 2.0 ATR for a stricter squeeze definition. A wider Keltner Channel means the Bollinger Bands must contract further to trigger a squeeze, producing fewer but potentially higher-quality signals.
Momentum settings: The default momentum oscillator period can be shortened for faster signals or lengthened for smoother readings. Most traders leave the momentum settings at their defaults.
FAQ
What is the difference between squeeze on and squeeze off?
Squeeze on (red dots) means Bollinger Bands are inside Keltner Channels, indicating low volatility compression. Squeeze off (green dots) means Bollinger Bands have expanded outside Keltner Channels, indicating the compression has released and a directional move is underway. The transition from red to green is the primary trading signal.
How long does a typical squeeze last?
On daily charts, a typical squeeze lasts 6 to 15 bars, representing roughly one to three weeks. Shorter squeezes (3-5 bars) tend to produce smaller moves, while longer squeezes (15+ bars) often precede larger breakouts. Weekly chart squeezes can last several months.
Can I use the TTM Squeeze for day trading?
Yes. Apply the TTM Squeeze to intraday charts (5-minute, 15-minute, or 60-minute) for day trading setups. The principles are the same, but the moves are smaller and faster. Intraday squeezes work best on liquid stocks with high average volume.
What platform has the TTM Squeeze?
Most major charting platforms include the TTM Squeeze or a close equivalent. Thinkorswim (TD Ameritrade) has it built in. TradingView offers community-built versions. Other platforms like TradeStation, NinjaTrader, and TC2000 also support the indicator, either natively or through custom scripts.
Is the TTM Squeeze the same as Bollinger Band Squeeze?
The concept is similar, but the TTM Squeeze adds the specific condition of Bollinger Bands moving inside Keltner Channels and includes a momentum histogram for directional bias. A simple Bollinger Band squeeze only identifies compression without providing directional guidance or the specific Keltner Channel reference.
Disclaimer
This is educational content, not financial advice. Trading involves risk, and you should consult a qualified financial advisor before making any investment decisions. Past performance does not guarantee future results.
Related Articles
12 chapters covering charts, indicators, risk management & more. Plus weekly trading insights.