McClellan Oscillator & Advance/Decline Line: Market Breadth Explained
⚡ Key Takeaways
- The McClellan Oscillator measures market breadth by applying two exponential moving averages (19-day and 39-day) to daily advance-decline data
- Positive readings indicate more stocks are advancing than declining on a momentum basis; negative readings indicate the opposite
- Breadth divergence, where the McClellan Oscillator diverges from the price index, is one of the most reliable warnings of trend exhaustion
- The McClellan Summation Index is the cumulative total of McClellan Oscillator values and identifies the market's intermediate to long-term trend
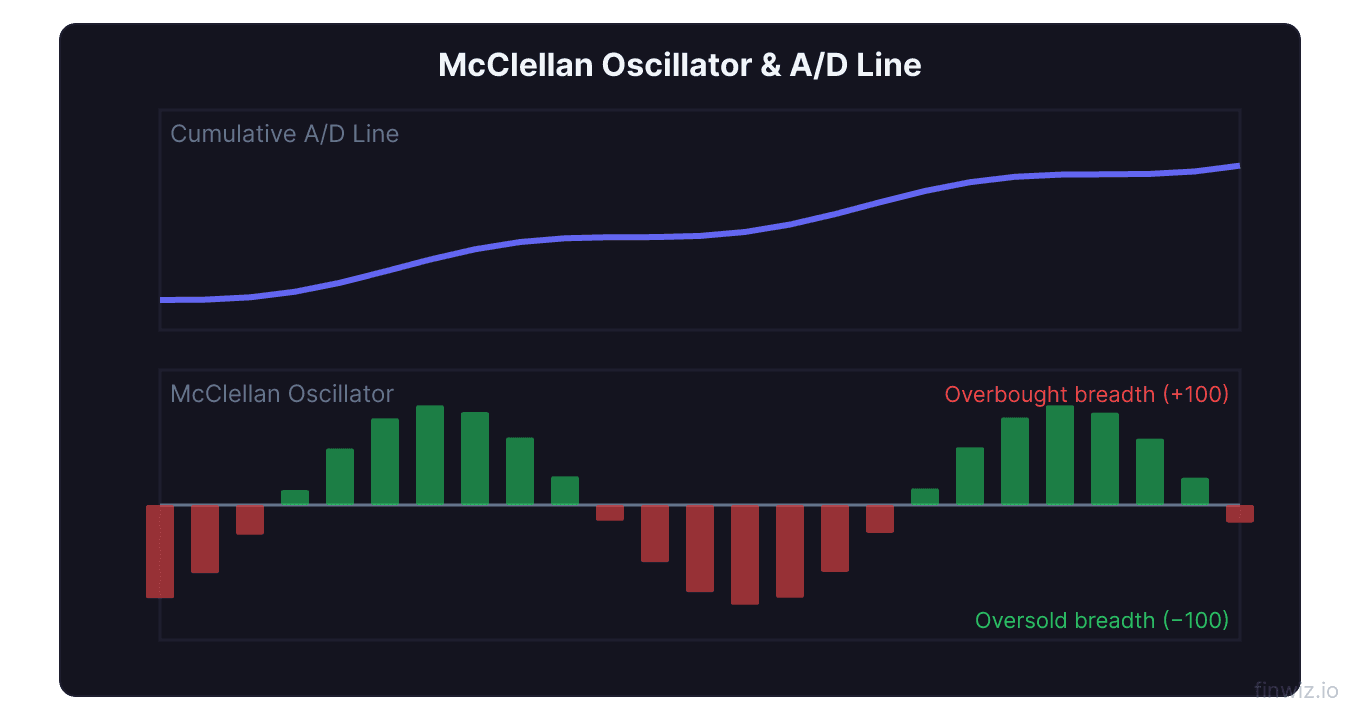
- Extreme readings above +100 or below -100 often indicate overbought or oversold market conditions that precede reversals
What Is the McClellan Oscillator?
The McClellan Oscillator is a market breadth indicator that measures the momentum of advancing versus declining stocks on an exchange. Developed by Sherman and Marian McClellan in 1969, it applies the difference between a 19-day and 39-day exponential moving average to daily advance-decline data, creating an oscillator that reveals whether buying or selling pressure is accelerating or decelerating across the broad market.
Unlike price-based indicators such as RSI or MACD that analyze individual securities, the McClellan Oscillator analyzes the internal health of the entire market. A market index like the S&P 500 can rise on the strength of a few mega-cap stocks while the majority of stocks decline. The McClellan Oscillator exposes this divergence, making it an essential tool for gauging whether a rally or decline has broad participation.
The oscillator fluctuates above and below zero, with positive readings indicating bullish breadth momentum and negative readings indicating bearish breadth momentum. Extreme readings, moves beyond +100 or below -100, often signal overbought or oversold market conditions.
How the McClellan Oscillator Is Calculated
The calculation starts with the daily advance-decline data from a stock exchange, typically the NYSE.
Net Advances = Number of Advancing Stocks - Number of Declining StocksThe 19-day EMA captures short-term breadth momentum, while the 39-day EMA captures intermediate-term breadth momentum. When the short-term EMA is above the long-term EMA, breadth momentum is positive and accelerating. When the short-term EMA falls below the long-term EMA, breadth momentum is negative and accelerating to the downside.
The choice of 19 and 39 periods corresponds roughly to a 10% and 5% smoothing factor, respectively. These values were chosen by the McClellans to match the speed of the MACD indicator's default 12/26 periods but applied to breadth data rather than price data.
Interpreting McClellan Oscillator Readings
The Zero Line
The zero line is the most important reference point. When the McClellan Oscillator is above zero, more stocks are advancing than declining on a momentum-adjusted basis, confirming a healthy market environment. When below zero, declining stocks are dominating.
Zero-line crossovers are trend signals. A cross from negative to positive suggests the market is transitioning from bearish to bullish breadth. A cross from positive to negative suggests the opposite. These crossovers are particularly significant after extended periods on one side of the zero line.
Extreme Readings
Readings above +100 indicate extremely strong breadth thrust. This can occur at the beginning of new bull markets or during powerful rallies. While it may seem overbought, the first move above +100 after a prolonged period below zero is typically a very bullish signal, indicating the start of a new uptrend.
Readings below -100 indicate extremely negative breadth, with the vast majority of stocks declining. While oversold, deeply negative readings during the initial stages of a bear market can persist and even deepen. However, readings below -150 to -200 often mark capitulation points where selling is near exhaustion.
Pro Tip
Breadth Divergence from Price
The most valuable use of the McClellan Oscillator is identifying breadth divergence, where the oscillator moves in the opposite direction of the price index.
Bearish breadth divergence: The S&P 500 (or another index) makes new highs, but the McClellan Oscillator makes lower highs or fails to reach its prior peak. This indicates that the rally is being driven by fewer and fewer stocks. The advance is narrowing and becoming vulnerable to reversal.
Bullish breadth divergence: The S&P 500 makes new lows, but the McClellan Oscillator makes higher lows. This indicates that fewer stocks are participating in the decline. Internal selling pressure is diminishing even as the index prints lower prices.
Breadth divergences preceded several major market turns, including the 2007 top (the S&P 500 made new highs in October 2007, but the McClellan Oscillator had been trending lower since July) and the 2009 bottom (the oscillator showed improving breadth well before the index bottomed).
The McClellan Summation Index
The McClellan Summation Index is the cumulative running total of all daily McClellan Oscillator values. While the Oscillator shows short-term breadth momentum, the Summation Index reveals the intermediate to long-term breadth trend.
McClellan Summation Index = Running cumulative sum of daily McClellan Oscillator valuesInterpreting the Summation Index
Above +1,000: Strong bullish breadth trend. The market is healthy and advances are likely to continue.
Between 0 and +1,000: Moderately bullish or neutral. The market may be transitioning.
Below 0: Bearish breadth trend. More stocks are in downtrends than uptrends.
Below -1,000: Extremely bearish breadth. The market is deeply oversold on a cumulative basis.
The Summation Index is particularly useful for identifying major market turning points. When the Summation Index drops below -1,000 and then begins to turn upward, it often signals the start of a significant rally or new bull market. Conversely, a Summation Index that peaks above +1,500 and begins declining can precede major corrections.
Summation Index Crossovers
Many analysts watch for the Summation Index to cross its own moving average. A Summation Index crossing above its 10-day SMA from deeply negative territory is a buy signal. A Summation Index crossing below its 10-day SMA from elevated positive territory is a sell signal.
Trading with the McClellan Oscillator
Market Timing
The McClellan Oscillator is primarily used for market timing rather than individual stock selection. It tells you whether the broad market environment favors being long or short.
Bullish market environment: McClellan Oscillator above zero and rising. Favor long positions, buy pullbacks, and be aggressive with new entries.
Bearish market environment: McClellan Oscillator below zero and declining. Favor cash or short positions, reduce exposure, and tighten stops on existing longs.
Transitional: McClellan Oscillator near zero or crossing the zero line. Exercise caution, reduce position sizes, and wait for clearer direction.
Combining with Index Analysis
Pair the McClellan Oscillator with the S&P 500 chart and its moving averages. When the S&P 500 is above its 200-day SMA and the McClellan Oscillator is positive, the market environment is strongly bullish. When the S&P 500 breaks below its 200-day SMA and the McClellan Oscillator is negative, conditions favor defense.
The most actionable signals come from disagreement between the two. If the S&P 500 is at new highs but the McClellan Oscillator shows bearish divergence, the rally may be fragile despite the strong headline number.
Historical Examples
The 2007 Market Top
Throughout 2007, the S&P 500 continued making new highs, reaching its peak in October at 1,565. However, the McClellan Oscillator had been making progressively lower highs since June 2007. This bearish breadth divergence warned that the rally was narrowing. The financial crisis and severe bear market followed.
The March 2009 Bottom
In March 2009, the McClellan Oscillator produced a powerful breadth thrust, surging from deeply negative territory (below -100) to positive territory in a matter of days. This breadth thrust, combined with the Summation Index turning upward from extremely negative levels, signaled the start of one of the longest bull markets in history.
The 2020 COVID Recovery
After the March 2020 crash, the McClellan Oscillator showed a massive breadth thrust in late March and early April, surging above +200. Despite widespread fear and uncertainty, this extreme positive breadth reading accurately signaled that the worst was over and a powerful recovery was beginning.
Limitations of the McClellan Oscillator
It measures breadth, not price. A market can have positive breadth while the cap-weighted index declines if small and mid-cap stocks rally while mega-caps fall. Similarly, the index can rise on narrow leadership while breadth deteriorates.
Short-term noise. On any given day, advance-decline data can be skewed by sector rotations, options expiration, or index rebalancing. The EMAs smooth this noise, but short-term readings can still be misleading.
Exchange-specific. The oscillator is calculated using data from a specific exchange (usually NYSE). Changes in the number of listed securities, the addition of ETFs and closed-end funds to exchange listings, and structural market changes can affect the indicator's characteristics over time.
Not useful for individual stocks. The McClellan Oscillator is a market-wide indicator. It cannot be applied to individual stock analysis. For individual stock momentum, use indicators like RSI, MACD, or CCI.
FAQ
Is the McClellan Oscillator a leading or lagging indicator?
The McClellan Oscillator is primarily a leading indicator when used for breadth divergence analysis. Breadth divergences from price often appear weeks or months before the price index itself reverses. However, for trend confirmation (zero-line crossovers), it functions more as a coincident indicator.
How often should I check the McClellan Oscillator?
For active traders, checking the McClellan Oscillator daily provides the best context for market health. Long-term investors may check it weekly, focusing on the McClellan Summation Index for intermediate-term trend assessment. There is no need to check it intraday since it is calculated from end-of-day data.
Can I use the McClellan Oscillator for the Nasdaq?
Yes. While the NYSE version is the most traditional, the McClellan Oscillator can be calculated using Nasdaq advance-decline data as well. Some analysts track both versions and compare them. A divergence between the NYSE and Nasdaq McClellan Oscillators can provide additional insights about market health.
What is a breadth thrust, and why does it matter?
A breadth thrust occurs when the McClellan Oscillator surges rapidly from deeply negative to strongly positive territory. This indicates a dramatic shift in market participation from bearish to bullish. Historically, breadth thrusts have preceded major bull market rallies, making them among the most reliable bullish signals in market analysis.
How does the McClellan Oscillator differ from the advance-decline line?
The advance-decline line is a cumulative measure of net advancing stocks. The McClellan Oscillator applies exponential moving averages to the daily advance-decline data, creating a momentum-based oscillator. The oscillator is better for identifying short-term overbought/oversold conditions and breadth momentum shifts, while the advance-decline line shows the longer-term cumulative trend.
Disclaimer
This is educational content, not financial advice. Trading involves risk, and you should consult a qualified financial advisor before making any investment decisions. Past performance does not guarantee future results.
Related Articles
12 chapters covering charts, indicators, risk management & more. Plus weekly trading insights.