Parabolic SAR: Trailing Stop Indicator for Trend Traders
⚡ Key Takeaways
- Parabolic SAR (Stop and Reverse) plots dots above or below price to indicate trend direction and provide trailing stop levels
- Dots below price indicate a bullish trend; dots above price indicate a bearish trend — when the dots flip, a trend reversal signal occurs
- The acceleration factor (AF) starts at 0.02 and increases by 0.02 with each new extreme, up to a maximum of 0.20, causing the dots to tighten over time
- Parabolic SAR works best in trending markets and produces excessive whipsaws in sideways or choppy conditions
- Combining Parabolic SAR with a trend filter like ADX (above 25) dramatically reduces false signals
What Is the Parabolic SAR?
The Parabolic SAR (Stop and Reverse) is a trend-following indicator developed by J. Welles Wilder Jr. and introduced in his 1978 book New Concepts in Technical Trading Systems. It provides potential entry and exit points by plotting a series of dots (or points) on a price chart that act as both trend direction indicators and trailing stop levels.
When the dots appear below the price, the trend is considered bullish. When the dots appear above the price, the trend is bearish. The moment the dots flip from one side to the other is the "stop and reverse" signal — a recommendation to close the current position and open one in the opposite direction.
The Parabolic SAR is unique among indicators because it provides a specific, dynamic price level that can be used directly as a trailing stop. This makes it one of the few indicators that translate immediately into actionable trade management decisions.
How Parabolic SAR Is Calculated
The Parabolic SAR calculation uses an acceleration factor that causes the dots to move closer to price as the trend develops.
SAR(tomorrow) = SAR(today) + AF x (EP - SAR(today))The Acceleration Factor (AF) is the key innovation. It starts at 0.02 when a new trend begins and increases by 0.02 each time the price makes a new extreme (new high in uptrend, new low in downtrend). The maximum AF is capped at 0.20 to prevent the dots from accelerating too quickly into the price.
As the AF increases, the SAR dots move closer to price, creating a tightening trailing stop effect. Early in a trend, the dots are far from price, giving the trend room to develop. As the trend matures and the AF approaches its maximum, the dots close in on price, making a stop-out (reversal) increasingly likely.
| AF Stage | Value | Effect on SAR Dots | Trend Phase |
|---|---|---|---|
| Initial | 0.02 | Dots far from price | Early trend — wide trailing stop |
| Developing | 0.04-0.10 | Dots approaching price | Mid-trend — moderate trailing stop |
| Mature | 0.12-0.18 | Dots close to price | Late trend — tight trailing stop |
| Maximum | 0.20 | Dots very close to price | Trend nearing exhaustion |
Pro Tip
Reading Parabolic SAR Signals
Interpreting Parabolic SAR is visually straightforward — the position of the dots relative to price tells you everything.
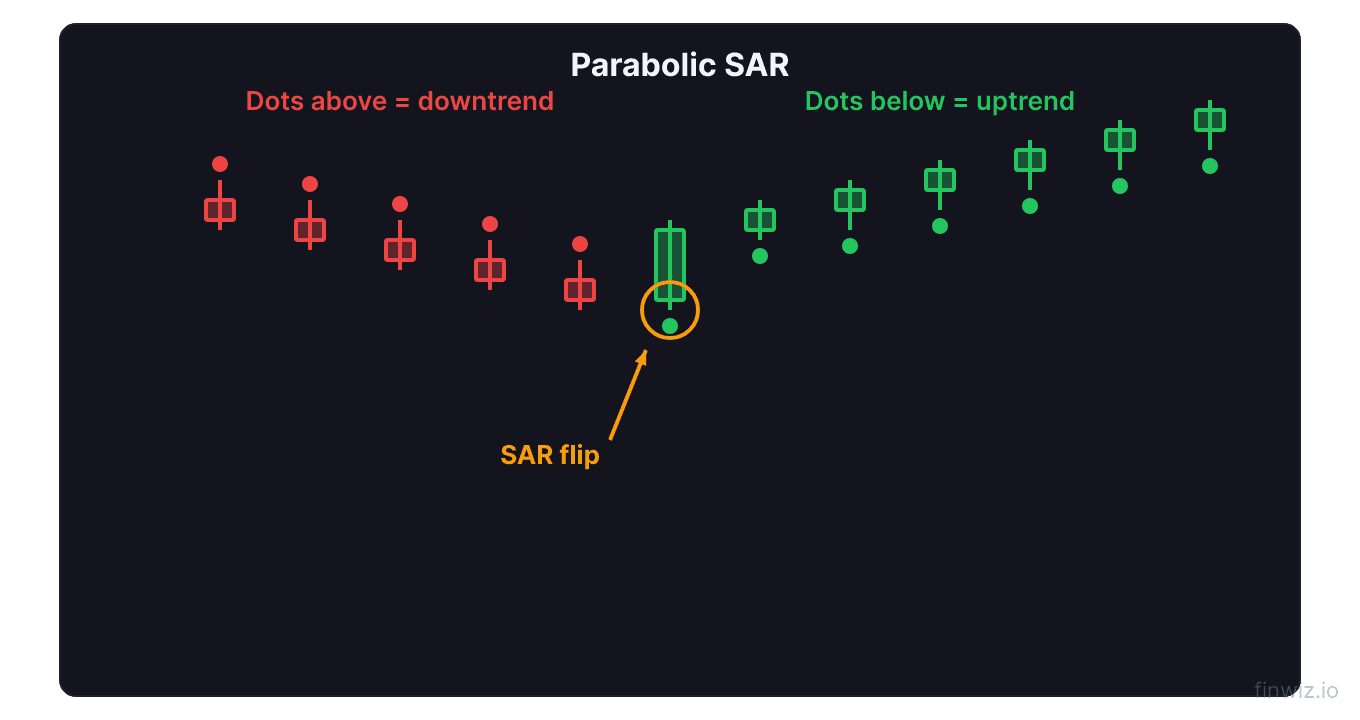
Dots below price = Bullish. The SAR dots below the candles indicate an uptrend. The dots provide a rising support level that acts as a trailing stop for long positions. As long as price stays above the dots, the uptrend is intact.
Dots above price = Bearish. SAR dots above the candles indicate a downtrend. The dots provide a declining resistance level that acts as a trailing stop for short positions. As long as price stays below the dots, the downtrend continues.
Dot flip = Reversal signal. When the dots switch from below to above (or vice versa), the indicator signals a trend reversal. This is the "stop and reverse" moment — close the current position and potentially open one in the opposite direction.
The dot flip is the most actionable signal from the Parabolic SAR. However, not all flips lead to sustained trend changes. In choppy markets, the dots can flip back and forth rapidly, producing whipsaw losses. This is why trend context matters enormously.
Parabolic SAR Trading Strategies
Strategy 1: Trend Following with SAR
The classic Parabolic SAR strategy: go long when dots flip below price and go short when dots flip above price. This always-in-the-market approach captures major trends but suffers in sideways markets. Use ADX above 25 as a filter to ensure the market is trending before acting on SAR signals.
Strategy 2: SAR as a Trailing Stop Only
Rather than using SAR for entry signals, use it solely as a trailing stop for positions entered based on other methods. Enter a trade based on a moving average crossover, RSI signal, or price pattern, then manage the position using Parabolic SAR as your trailing stop. Exit when the SAR dots flip to the opposite side of your trade.
Strategy 3: SAR with Moving Average Filter
Combine Parabolic SAR with a 200-day moving average as a trend filter. Only take long SAR signals (dots flipping below price) when price is above the 200 MA. Only take short SAR signals when price is below the 200 MA. This filter eliminates counter-trend SAR signals that are more likely to fail.
Strategy 4: SAR and MACD Confluence
Use MACD to confirm SAR reversal signals. When SAR dots flip bullish and MACD is also crossing bullish (or MACD histogram is turning positive), the combined signal has a higher probability of leading to a sustained trend. When only one indicator signals a reversal and the other does not confirm, the signal is weaker.
Strategy 5: Multi-Timeframe SAR
Check the weekly SAR for the primary trend direction and the daily SAR for trade timing. Only take daily long SAR signals when the weekly SAR is also bullish (dots below price). This alignment ensures that your trades follow the larger trend, dramatically reducing whipsaw losses.
Parabolic SAR Settings
The default Parabolic SAR settings use a start AF of 0.02, an AF increment of 0.02, and a maximum AF of 0.20. Adjustments can optimize the indicator for different trading styles.
| Setting | Start AF | AF Step | Max AF | Behavior |
|---|---|---|---|---|
| Default | 0.02 | 0.02 | 0.20 | Balanced for swing trading |
| Sensitive | 0.03 | 0.03 | 0.20 | Faster signals, more whipsaws |
| Conservative | 0.01 | 0.01 | 0.10 | Slower signals, fewer whipsaws |
| Day trading | 0.02 | 0.02 | 0.20 | Default works well on intraday charts |
Increasing the start AF and step makes the SAR more responsive. The dots will be closer to price and will flip sooner when price reverses. This is useful for short-term trading but produces more false signals.
Decreasing the start AF and step makes the SAR less responsive. The dots stay further from price and take longer to flip. This gives trends more room but means you exit later when a reversal occurs.
Reducing the maximum AF prevents the dots from ever getting extremely close to price. This is useful for volatile instruments where you do not want the SAR to tighten too aggressively, which would trigger premature exits during normal pullbacks.
Pro Tip
Parabolic SAR on Different Markets
Stocks: Parabolic SAR works well on stocks that exhibit clear trends. Growth stocks and momentum leaders produce the best SAR signals because they tend to trend for extended periods. Avoid using SAR on range-bound utility stocks or defensive sectors.
Forex: The indicator is popular in forex markets because currency pairs tend to trend well. The 4-hour and daily charts are the most effective timeframes for forex SAR analysis. The continuous nature of forex trading means fewer gap-related issues with the indicator.
Cryptocurrency: Crypto's strong trending nature makes it a good candidate for Parabolic SAR analysis. The significant volatility in crypto markets means you may want to use more conservative settings (lower max AF) to avoid premature stop-outs during sharp but temporary pullbacks.
Futures and commodities: Trending commodity markets respond well to SAR signals. Oil, gold, and agricultural futures in trending phases produce clean SAR signals on daily charts.
Common Parabolic SAR Mistakes
Using SAR in sideways markets. This is the number one mistake. Parabolic SAR is a trend-following indicator that assumes the market is always in a trend. In consolidating markets, the dots flip back and forth constantly, generating losses with each whipsaw. Always verify that the market is trending (using ADX above 25 or visual assessment) before relying on SAR signals.
Treating every dot flip as a trade signal. Not every SAR reversal leads to a sustained move. Many reversals, especially in choppy conditions, are temporary. Require confirmation from another indicator (MACD, RSI, or volume) before acting on SAR flips.
Using SAR as your only indicator. Parabolic SAR provides trend direction and a trailing stop level but does not measure momentum, volume, or overbought/oversold conditions. It must be part of a broader trading system that addresses these dimensions.
Not adjusting for volatility. The default SAR settings assume a standard level of volatility. In extremely volatile stocks or during high-volatility events (earnings, FOMC), the standard SAR may tighten too quickly. Consider reducing the AF step or maximum during periods of elevated volatility.
Parabolic SAR vs. Other Trailing Stops
| Trailing Stop Method | Based On | Advantage | Disadvantage |
|---|---|---|---|
| Parabolic SAR | Acceleration formula | Systematic, tightens automatically | Whipsaws in ranges |
| ATR Trailing Stop | Volatility (ATR) | Adapts to volatility | Does not tighten over time |
| Moving Average | Price average | Simple, widely watched | Can be too slow in fast markets |
| Chandelier Exit | ATR from high/low | Good for trend following | Requires parameter selection |
| Percentage Trailing | Fixed % from high | Simplest to implement | Ignores volatility changes |
Each trailing stop method has its place. Parabolic SAR is best when you want a systematic stop that tightens automatically as trends mature. ATR-based stops are better when you want a volatility-adjusted stop that maintains consistent distance. Moving averages work as trailing stops when you want alignment with widely-watched price levels.
Frequently Asked Questions
Is Parabolic SAR good for beginners?
Parabolic SAR is one of the most visually intuitive indicators, making it accessible for beginners. The dots clearly show trend direction and provide specific stop-loss levels. However, beginners must learn its primary limitation — poor performance in sideways markets — early on to avoid costly whipsaw losses. Starting with SAR as a trailing stop for positions entered using other methods (rather than as a standalone entry signal) is the best approach for new traders.
What is the best Parabolic SAR setting?
The default settings (0.02 start, 0.02 step, 0.20 max) work well for most applications on daily charts. For more volatile instruments or longer-term trades, reduce the step to 0.01 and the max to 0.10-0.14 to give trends more room. For faster, more responsive signals, increase the step to 0.03. The best setting depends on your specific market and timeframe — always backtest adjustments before implementing them in live trading.
How do you avoid Parabolic SAR whipsaws?
The most effective way to reduce whipsaws is to add a trend filter. Use ADX above 25 to confirm a trend exists before acting on SAR signals. Alternatively, use a moving average filter — only take long SAR signals above the 200 MA and short signals below. Another approach is to require SAR confirmation from a second timeframe — only act on daily SAR flips that align with the weekly SAR direction. Each of these filters significantly reduces false reversal signals.
Can Parabolic SAR be used for day trading?
Yes, Parabolic SAR is popular among day traders, particularly on 5-minute and 15-minute charts. The default settings work on intraday timeframes. Day traders often combine SAR with VWAP — using VWAP for directional bias and SAR for trailing stop management. The key is still avoiding choppy, range-bound conditions. If the intraday session is trending, SAR performs well. If the session is choppy, SAR will whipsaw. Use the first 30-60 minutes of trading to assess whether the day is trending before relying on SAR signals.
How does Parabolic SAR compare to moving average crossovers?
Both are trend-following methods, but they differ in execution. Moving average crossovers provide entry signals when a fast MA crosses a slow MA but do not provide a specific trailing stop level. Parabolic SAR provides both entry signals (dot flips) and a specific trailing stop price. SAR also naturally tightens over time due to the acceleration factor, while moving averages maintain consistent distance from price. Many traders use moving average crossovers for entries and Parabolic SAR for trade management and exits.
Disclaimer
This is educational content, not financial advice. Trading involves risk, and you should consult a qualified financial advisor before making any investment decisions. Past performance does not guarantee future results.
12 chapters covering charts, indicators, risk management & more. Plus weekly trading insights.