Standard Deviation Indicator: Measuring Volatility in Real Time
⚡ Key Takeaways
- The Standard Deviation indicator measures how far price disperses from its mean over a set period, quantifying real-time volatility as a single value.
- Rising standard deviation signals expanding volatility and potential breakout conditions; falling standard deviation signals contraction and an impending move.
- Standard deviation is the mathematical engine behind Bollinger Bands — the bands are plotted at fixed standard deviation multiples above and below a moving average.
- Common settings are 20-period with closing prices, though traders adjust the lookback period to match their timeframe and strategy.
What Is the Standard Deviation Indicator?
The Standard Deviation indicator plots the statistical standard deviation of price over a rolling lookback period directly on your chart as a line. It answers a single question: how volatile is this stock right now compared to its recent history?
Standard deviation is a foundational concept in statistics. Applied to trading, it measures the average distance each closing price falls from the mean closing price over the chosen period. A high reading means prices are scattered widely from the average — the stock is volatile. A low reading means prices are clustering tightly around the average — the stock is quiet.
Unlike directional indicators that tell you where price is headed, the standard deviation indicator tells you about the character of price movement. It measures intensity, not direction. This makes it a volatility tool rather than a trend tool, placing it alongside ATR and Bollinger Band width as a core volatility gauge.
Standard Deviation = √[(Σ(Pᵢ - P̄)²) / n]How to Read the Indicator
The standard deviation indicator displays as a single line in a separate panel below the price chart. It does not have a fixed scale — its value depends on the stock's price level and volatility characteristics. A $500 stock will naturally have a higher standard deviation reading than a $20 stock, even if both are experiencing similar percentage volatility.
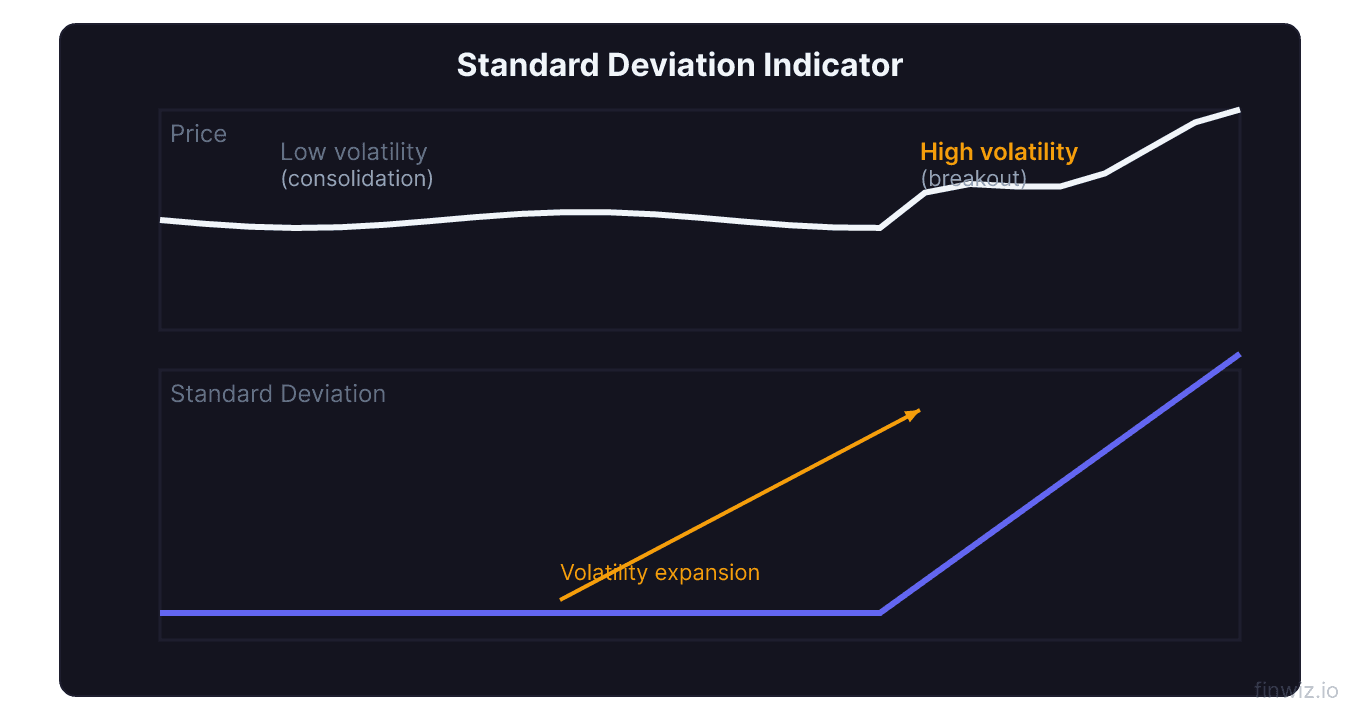
Rising line: Volatility is expanding. Price bars are getting larger, and the distance between recent highs and lows relative to the mean is increasing. This often accompanies breakouts, trend initiations, or reactions to news. When NVDA reported earnings in early 2024, its standard deviation spiked sharply as daily ranges expanded from $10 to $40+.
Falling line: Volatility is contracting. Price is consolidating, and individual bars are shrinking. This is the compression phase that typically precedes a significant directional move. Falling standard deviation on a stock like AMZN during a tight range often signals that a breakout is building.
Flat line at low levels: Extended low volatility. The stock has been trading in a narrow range for an extended period. This is the setup that volatility-based traders watch most closely because prolonged compression tends to resolve with explosive expansion.
Standard Deviation and Bollinger Bands
The standard deviation indicator and Bollinger Bands are mathematically linked. Bollinger Bands plot a 20-period SMA as the middle band, then add and subtract 2 standard deviations to create the upper and lower bands. The width between the bands is literally the standard deviation multiplied by 4 (2 above, 2 below).
When the standard deviation indicator rises, Bollinger Bands widen. When it falls, they contract (the Bollinger squeeze). Trading the standard deviation indicator directly gives you a cleaner visualization of the volatility cycle without the visual noise of band-price interaction.
Some traders prefer plotting standard deviation instead of using Bollinger Bands because it isolates the volatility reading from price. You see one clean line showing volatility expansion and contraction rather than interpreting the relationship between price candles and band boundaries.
Optimal Settings
The 20-period lookback is standard across most platforms and aligns with the 20-period SMA used in Bollinger Bands. This covers roughly one trading month on a daily chart.
Shorter periods (10-14) make the indicator more responsive to recent volatility changes. Day traders on 5-minute or 15-minute charts often use 10-period standard deviation to catch intraday volatility shifts quickly. The tradeoff is more noise and more false signals.
Longer periods (30-50) smooth the reading and capture the broader volatility trend. Swing traders use these settings to identify multi-week compression and expansion cycles. A 50-period standard deviation on a daily chart of SPY provides a clear view of whether overall market volatility is trending higher or lower.
Pro Tip
Trading Strategies with Standard Deviation
Volatility breakout. When standard deviation drops to its lowest level in 50+ bars and then begins rising sharply, a breakout is underway. Enter in the direction of the price breakout with a stop below the consolidation range. This strategy captures the initial thrust of a new trend.
Mean reversion. When standard deviation spikes to extreme levels (2+ times its 50-period average), price has stretched far from its mean and a reversion is likely. This approach works well on range-bound stocks and indices. Wait for the standard deviation to peak and begin declining before entering a counter-trend position.
Volatility filter. Use standard deviation as a filter for other strategies. Only take breakout trades when standard deviation is rising. Only take mean-reversion trades when standard deviation is elevated and turning down. This prevents breakout trades during low-volatility chop and mean-reversion trades during genuine trending conditions.
Standard Deviation vs. ATR
Both measure volatility, but they use different inputs. Standard deviation measures the dispersion of closing prices from their mean. ATR measures the average range of each individual bar (including gaps). ATR captures intrabar and gap volatility, while standard deviation captures close-to-close volatility.
In practice, ATR is more commonly used for setting stop losses and position sizing because it directly measures price range. Standard deviation is more commonly used for identifying volatility cycles and as a component within other indicators like Bollinger Bands and Keltner Channels.
When the two diverge — ATR rising while standard deviation stays flat — it means individual bars have large ranges but closing prices are not moving away from the mean. This is a classic sign of indecision and a range-bound market. When both rise together, a genuine directional move is underway.
Frequently Asked Questions
What does a high standard deviation mean for a stock?
A high standard deviation means the stock's recent closing prices are spread widely from their average — the stock is experiencing elevated volatility. This can result from earnings announcements, sector catalysts, or broader market stress. High standard deviation alone does not indicate direction, only that price is moving aggressively. Stocks like TSLA routinely operate at higher standard deviation levels than defensive names like PG or KO.
Should I use standard deviation or Bollinger Bands?
Use both for different purposes. Bollinger Bands show price relative to its volatility envelope, which is useful for identifying overbought/oversold conditions and squeeze setups. The standard deviation indicator isolates the volatility reading itself, making it better for tracking volatility cycles and building volatility-filtered systems. Many traders plot Bollinger Bands on the price chart and standard deviation in a separate panel.
Can standard deviation predict market crashes?
Standard deviation does not predict crashes, but it provides warning signs. An extended period of unusually low standard deviation across broad market indices often precedes a sharp volatility expansion. The VIX (which is derived from options-implied volatility, not standard deviation directly) serves a similar warning function. When the standard deviation of SPY drops to multi-year lows, experienced traders prepare for a potential regime change rather than assuming calm conditions will persist.
12 chapters covering charts, indicators, risk management & more. Plus weekly trading insights.