Donchian Channels: The Original Breakout Indicator
⚡ Key Takeaways
- Donchian Channels plot the highest high and lowest low over a set period (default 20 days), creating upper and lower bands that define the current price range.
- The channel was popularized by the famous Turtle Trading experiment, where a breakout above the upper band triggered buy signals and a breakout below the lower band triggered sell signals.
- Donchian Channels are a pure trend-following and breakout system — they excel in trending markets but produce false signals (whipsaws) in range-bound conditions.
- The middle line (average of the upper and lower bands) serves as a dynamic support/resistance level and can be used for trailing stop placement.
- Unlike Bollinger Bands (which use standard deviation) and Keltner Channels (which use ATR), Donchian Channels use raw high/low extremes, making them the simplest volatility-based channel.
What Is the Donchian Channel?
The Donchian Channel is a trend-following indicator created by Richard Donchian, widely regarded as the father of trend following. The indicator consists of three lines plotted on a price chart: an upper band at the highest high over N periods, a lower band at the lowest low over N periods, and a middle line at the average of the two bands.
The concept is elegantly simple: the upper band represents the highest price achieved over the lookback period, while the lower band represents the lowest price. When price breaks above the upper band, it establishes a new high for the period — a breakout that may signal the start of an uptrend. When price breaks below the lower band, it establishes a new low — a potential downtrend signal.
Donchian Channels gained legendary status through the Turtle Trading experiment of the 1980s, where Richard Dennis and William Eckhardt used a channel breakout system to train a group of novice traders who went on to earn hundreds of millions of dollars.
The Donchian Channel Formula
Upper Band = Highest High over the last N periods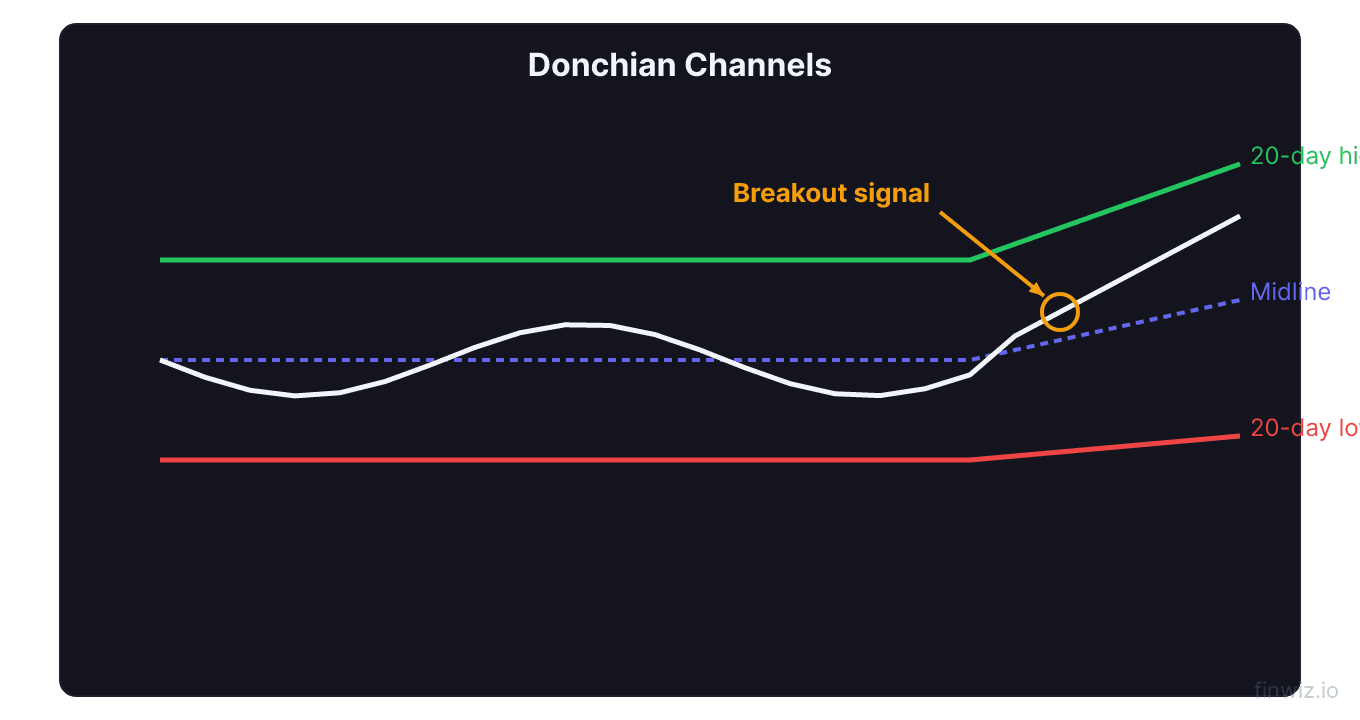
The formula is remarkably straightforward. There is no averaging, no standard deviation, no exponential smoothing — just the raw high and low extremes over the lookback period. This simplicity is both the indicator's greatest strength (no ambiguity) and its limitation (no nuance).
How the Bands Move
The upper band only changes when a new high is set or when the oldest high in the lookback window drops out of the calculation. This creates a staircase effect where the band remains flat until a new extreme occurs, then steps up.
The lower band behaves similarly in reverse — it stays flat until a new low is set or an old low drops out, then it steps down or up.
This staircase movement is visually distinctive and different from the smooth curves of Bollinger Bands or Keltner Channels.
Pro Tip
The Turtle Trading System
The Turtle Trading experiment is one of the most famous stories in trading history, and the Donchian Channel was at its core.
The Original System
In 1983, commodities trader Richard Dennis bet that trading could be taught. He recruited 13 novices (the "Turtles"), taught them a trend-following system based on Donchian Channel breakouts, and gave them real money to trade.
The core rules were:
| Rule | Entry System 1 | Entry System 2 |
|---|---|---|
| Buy | Break above 20-day high | Break above 55-day high |
| Sell short | Break below 20-day low | Break below 55-day low |
| Exit long | Break below 10-day low | Break below 20-day low |
| Exit short | Break above 10-day high | Break above 20-day high |
| Position sizing | Based on ATR (volatility) | Based on ATR (volatility) |
Why It Worked
The Turtle system worked because it captured large trends in commodity markets. While many individual trades were small losers (breakouts that quickly reversed), the winning trades were large enough to more than compensate. The system's edge came from letting winners run and cutting losses short — exactly what the Donchian Channel breakout framework facilitates.
Modern Application
The original Turtle rules are still traded today, though they have lost some of their edge as markets have become more efficient. Modern adaptations include:
- Adding volume filters to confirm breakouts
- Using the ADX to trade only when trends are strong
- Incorporating fundamental filters to avoid trading against major macro trends
- Adjusting the period from 20 to other values based on the specific market
Trading with Donchian Channels
Breakout Entry Strategy
The most straightforward Donchian strategy: buy when price closes above the upper band and sell (or short) when price closes below the lower band.
Long entry: Price closes above the 20-day high (upper band). This establishes a new 20-day high and signals potential uptrend initiation.
Short entry: Price closes below the 20-day low (lower band). This establishes a new 20-day low and signals potential downtrend initiation.
Exit: Use a shorter-period Donchian Channel for exits. The classic exit uses a 10-day channel: exit longs when price breaks below the 10-day low; exit shorts when price breaks above the 10-day high.
Middle Line Strategy
The Donchian middle line (average of upper and lower bands) serves as a dynamic support/resistance level.
- In uptrends, pullbacks to the middle line often find support — enter long on bounces from the middle line
- In downtrends, rallies to the middle line often meet resistance — enter short on rejections from the middle line
- Use the middle line as a trailing stop for trend trades
Channel Width Strategy
The width of the Donchian Channel (upper band minus lower band) measures volatility.
- Narrow channels: Low volatility, potential for a breakout (similar to a Bollinger Band squeeze)
- Wide channels: High volatility, trend in progress
- Narrowing channels: Declining volatility, consolidation developing
Watch for narrow channels that suddenly widen as price breaks above the upper band or below the lower band. These breakouts from low-volatility compression often produce the most profitable trend trades.
Donchian Channel Period Settings
| Period | Application | Sensitivity | Best Market |
|---|---|---|---|
| 10 | Short-term / exit trigger | High | Fast markets |
| 20 | Standard / Turtle system | Moderate | Most markets |
| 50-55 | Long-term trends | Low | Position trading |
| 100 | Major trends | Very low | Investing |
Some traders use a dual-channel approach: a longer period (55-day) for entries and a shorter period (20-day) for exits. This captures larger trends while providing earlier exits when the trend weakens.
Donchian vs. Bollinger Bands vs. Keltner Channels
These three channel-based indicators serve different purposes despite looking similar on charts.
| Feature | Donchian Channel | Bollinger Bands | Keltner Channels |
|---|---|---|---|
| Basis | Highest high / Lowest low | Moving average ± std. dev. | EMA ± ATR multiple |
| Center line | Average of bands | Moving average | EMA |
| Band movement | Staircase (step-like) | Smooth, dynamic | Smooth, dynamic |
| Volatility measure | Raw range | Standard deviation | ATR |
| Primary use | Breakout trading | Mean reversion + breakout | Trend following |
| Sensitivity | Responsive to new extremes | Responsive to volatility changes | Responsive to volatility changes |
| Whipsaw risk | High in ranges | Moderate | Lower |
When to Choose Donchian
Choose Donchian Channels when you want a pure breakout system with clear, unambiguous signals. The staircase bands create precise trigger levels. Donchian is ideal for systematic trend following where you need objective, automatable rules.
When to Choose Bollinger or Keltner
Choose Bollinger Bands for mean reversion trading (buying at the lower band, selling at the upper) and for identifying volatility squeezes. Choose Keltner Channels for trend-following with smoother bands and less whipsaw than Donchian.
Pro Tip
Risk Management with Donchian Channels
Position Sizing
The Turtle system used ATR-based position sizing:
Unit Size = (Account × Risk Percentage) / (ATR × Dollar per Point)This approach ensures that each position carries approximately the same dollar risk regardless of the security's volatility.
Stop Placement
Channel-based stop: Use the opposite band as the stop. When long (entered on upper band breakout), the lower band serves as the stop. This creates a wide stop but allows the trade to breathe.
Middle line stop: Use the middle line as a tighter stop. This reduces risk per trade but may exit winners too early.
ATR-based stop: Place the stop 2 ATR units from the entry price. This is independent of the channel bands and provides consistent risk control.
Limitations
Whipsaws in ranges. Donchian Channels generate many false breakout signals during range-bound, sideways markets. The system triggers entries at new highs and lows that quickly reverse, producing strings of small losses.
Lagging signals. Because the bands are based on historical highs and lows, the system does not enter at the beginning of trends — it enters after price has already made a new extreme.
Late exits. The 10-day or 20-day exit often gives back a significant portion of trend profits before triggering. This is inherent in trend-following systems — you must accept giving back some gains to stay in the trend.
Not suitable for all markets. Donchian breakout systems work best in markets that exhibit strong trending behavior, such as commodities, currencies, and trending stocks. In range-bound markets, the system underperforms.
Frequently Asked Questions
What is the best Donchian Channel period?
The 20-period setting is the most popular and historically tested. It corresponds to approximately one trading month and was used in the Turtle Trading system. For longer-term trends, use 50-55 periods. For shorter-term trading, use 10 periods.
Can Donchian Channels be used for day trading?
Yes, Donchian Channels work on intraday charts. Use a 20-period Donchian on 15-minute or 30-minute charts for intraday breakout trading. However, intraday breakouts are noisier and produce more whipsaws. Consider adding volume confirmation and VWAP filters for intraday application.
How do I avoid whipsaws with Donchian Channels?
Several filters reduce whipsaws: require the breakout candle to close beyond the band (not just touch it); add a percentage filter (price must exceed the band by 0.5-1%); use the ADX above 20-25 as a trend strength filter; and require above-average volume on the breakout candle.
Is the Turtle Trading system still profitable?
The original Turtle system has lost some of its edge due to market evolution, but the core principles remain valid. Modified versions that incorporate volatility filters, market regime detection, and refined position sizing continue to produce positive returns in trending markets. The system's edge has diminished in stocks but remains viable in commodities and currencies.
Can Donchian Channels be used with other indicators?
Yes, and this is recommended to filter false signals. Popular combinations include Donchian with ADX (trend strength filter), Donchian with RSI (momentum confirmation), and Donchian with moving averages (trend direction filter). The Aroon indicator is conceptually related and can provide complementary trend analysis.
What markets work best for Donchian Channel breakout trading?
Markets that exhibit strong trending behavior, including futures (commodities, bonds, currencies), trending equities, and ETFs. Markets that tend to mean-revert or trade in ranges (like many individual stocks during sideways markets) produce excessive whipsaws with Donchian-based systems.
Disclaimer
This is educational content, not financial advice. Trading involves risk, and you should consult a qualified financial advisor before making any investment decisions. Past performance does not guarantee future results.
12 chapters covering charts, indicators, risk management & more. Plus weekly trading insights.