TRIX & ROC: Rate of Change Indicators for Filtering Noise
⚡ Key Takeaways
- TRIX is a momentum oscillator that displays the percentage rate of change of a triple-smoothed exponential moving average, filtering out insignificant price movements
- Zero-line crossovers provide trend signals: TRIX above zero is bullish, below zero is bearish
- A 9-period signal line can be added to TRIX to generate crossover buy and sell signals, similar to how the signal line works on MACD
- The triple-smoothing process eliminates most short-term noise, making TRIX particularly effective for identifying the primary trend direction
- TRIX divergence from price often provides early warnings of trend reversals, similar to MACD divergence but with fewer false signals due to the smoothing
What Is the TRIX Indicator?
The TRIX indicator (Triple Exponential Average) is a momentum oscillator that shows the percentage rate of change of a triple-smoothed exponential moving average. Developed by Jack Hutson in the early 1980s, TRIX is designed to filter out insignificant price fluctuations and highlight only the most meaningful trend changes.
The key advantage of TRIX is its smoothing process. By applying three consecutive EMAs to the price data and then measuring the rate of change, TRIX eliminates the short-term noise that plagues simpler indicators. Cycles and price movements shorter than the TRIX period are effectively filtered out, leaving only the dominant trend signal.
TRIX oscillates above and below a zero line. Positive values indicate bullish momentum (the smoothed trend is rising), and negative values indicate bearish momentum (the smoothed trend is declining). Because of its heavy smoothing, TRIX is slower to react than indicators like RSI or MACD, but it produces far fewer false signals.
How TRIX Is Calculated
The TRIX calculation involves four steps: three rounds of exponential smoothing followed by a percentage rate of change calculation.
Step 1: First EMAEach round of EMA smoothing progressively removes more short-term noise. The first EMA smooths raw price data. The second EMA smooths the already-smoothed data, removing more fluctuations. The third EMA smooths again, leaving only the most persistent trend component.
The final step converts this triple-smoothed value into a rate of change, creating an oscillator that shows whether the underlying trend is accelerating or decelerating. This is what appears on your chart as the TRIX line.
TRIX Signal Types
Zero-Line Crossovers
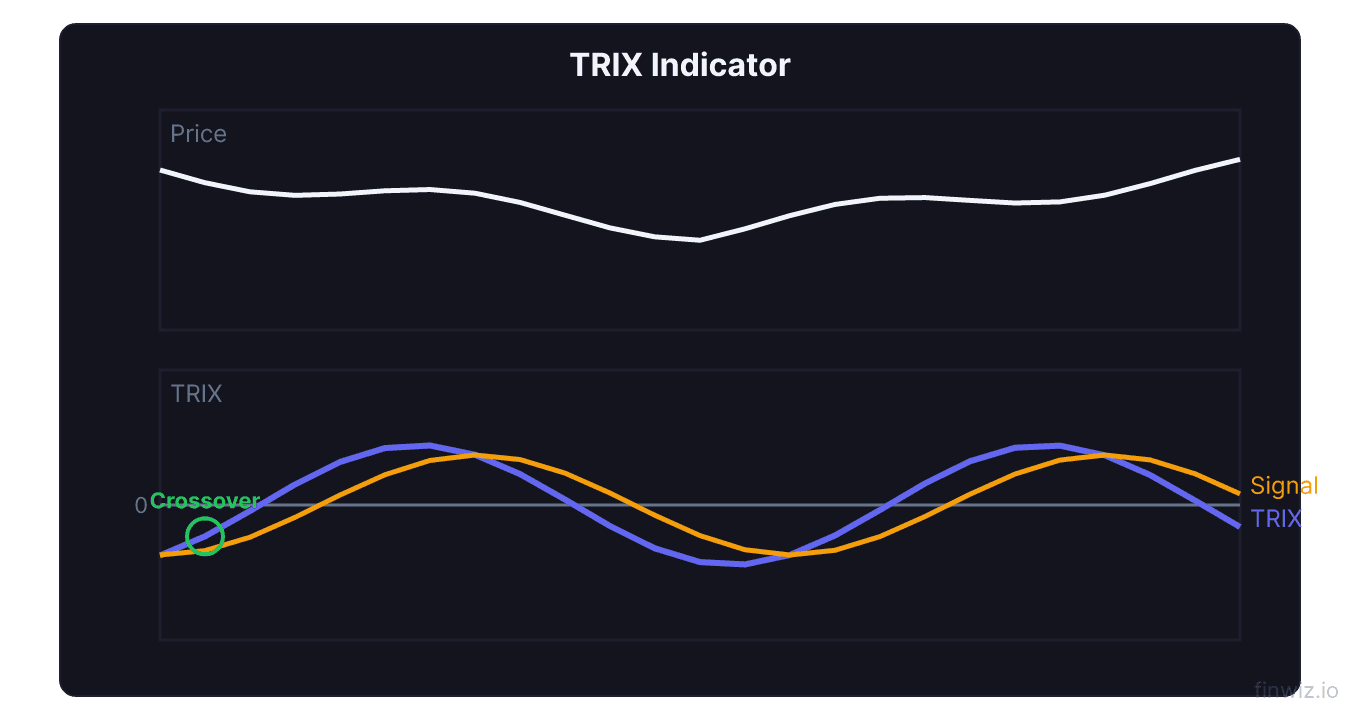
The most fundamental TRIX signal is the zero-line crossover.
Bullish signal: TRIX crosses from negative to positive territory. The triple-smoothed trend has shifted from declining to rising. This confirms a new uptrend.
Bearish signal: TRIX crosses from positive to negative territory. The triple-smoothed trend has shifted from rising to declining. This confirms a new downtrend.
Because of the triple smoothing, zero-line crossovers on TRIX are significantly more reliable than similar crossovers on faster indicators. When TRIX crosses zero, a genuine trend change is likely underway, not just a temporary fluctuation.
Signal Line Crossovers
Many traders add a signal line to TRIX, typically a 9-period EMA of the TRIX value. This creates crossover signals similar to the MACD signal line crossover.
Buy signal: TRIX crosses above its signal line. Sell signal: TRIX crosses below its signal line.
Signal line crossovers occur more frequently than zero-line crossovers and provide earlier entry signals. However, they are also more prone to false signals, especially when TRIX is near the zero line.
Pro Tip
TRIX Divergence
TRIX divergence occurs when the indicator moves in the opposite direction of price and is one of TRIX's strongest signals.
Bullish divergence: Price makes a lower low, but TRIX makes a higher low. The triple-smoothed trend momentum is improving even as price drops, suggesting the decline is losing conviction.
Bearish divergence: Price makes a higher high, but TRIX makes a lower high. Despite new price highs, the underlying trend momentum is weakening.
Because TRIX is heavily smoothed, its divergence signals are less frequent than MACD divergence but tend to be more meaningful. When TRIX diverges from price, it reflects a genuine shift in the dominant trend momentum, not just short-term noise.
TRIX Settings and Customization
The default TRIX period is typically 15, though some platforms use 12 or 14. The period determines the length of each of the three EMAs.
| TRIX Period | Signal Speed | Noise Filtering | Best For |
|---|---|---|---|
| 9-12 | Faster | Moderate | Active swing trading |
| 15 (default) | Balanced | Good | All-purpose |
| 18-21 | Slower | Strong | Position trading, trend identification |
| 30+ | Very slow | Excellent | Long-term trend confirmation |
Shorter periods make TRIX more responsive but reintroduce some of the noise the indicator is designed to eliminate. A 9-period TRIX responds similarly in speed to a standard MACD but with smoother output.
Longer periods create an extremely smooth indicator that identifies only the most significant trend changes. A 30-period TRIX might only produce a few signals per year on a daily chart, but each signal tends to be highly reliable.
TRIX vs. MACD
TRIX and MACD are frequently compared because both are momentum oscillators that use EMAs and oscillate around a zero line. However, they differ in important ways.
| Feature | TRIX | MACD |
|---|---|---|
| Smoothing | Triple EMA + ROC | Difference of two EMAs |
| Noise filtering | Excellent | Moderate |
| Signal speed | Slower | Faster |
| False signals | Fewer | More |
| Divergence reliability | Higher | Moderate |
| Popularity | Moderate | Very high |
| Components | One line + optional signal line | MACD line + signal line + histogram |
TRIX advantages over MACD: Better noise filtering, fewer false signals, more reliable divergence readings. TRIX is less likely to whipsaw you during choppy periods.
MACD advantages over TRIX: Faster signals, more widely followed (which adds to its effectiveness through self-fulfilling prophecy), provides the histogram for additional momentum reading, and generates more frequent trading opportunities.
Many traders use both: MACD for timing entries and exits, and TRIX for confirming the primary trend direction. When both indicators agree on direction, the probability of a successful trade increases significantly.
Trading Strategies with TRIX
Trend Confirmation Strategy
Use TRIX as a trend filter for other trading signals. Only take long trades from other indicators (RSI, Bollinger Bands, pattern breakouts) when TRIX is above zero or rising. Only take short trades when TRIX is below zero or declining.
This approach uses TRIX's strength (excellent trend identification) while relying on faster indicators for timing.
Dual TRIX Strategy
Apply two TRIX indicators with different periods: a faster TRIX (e.g., 12-period) and a slower TRIX (e.g., 20-period). Buy when the faster TRIX crosses above the slower TRIX. Sell when the faster TRIX crosses below the slower TRIX.
This is analogous to a moving average crossover system but applied to momentum rather than price. The crossover signals are smoother and more reliable than raw price moving average crossovers.
TRIX with Volume
Combine TRIX signals with volume analysis. A TRIX zero-line crossover accompanied by above-average volume confirms that the momentum shift has real participation behind it. A crossover on low volume is more likely to fail.
Real-World Application
Consider applying TRIX to the S&P 500 ETF (SPY) on a daily chart with the default 15-period setting and a 9-period signal line.
During the 2022 bear market, TRIX crossed below zero in late January 2022 and remained negative for most of the year. The zero-line crossover confirmed the bearish trend early and kept traders on the defensive side throughout the decline.
In early 2023, TRIX crossed back above zero as the market began its recovery. The zero-line crossover in February 2023 confirmed the bullish trend shift. TRIX divergence had already appeared at the October 2022 lows, where the S&P 500 made lower lows but TRIX showed a higher low, providing an early warning of the trend change.
A trader using TRIX as a trend filter would have avoided most of the 2022 decline and re-entered near the start of the 2023 recovery.
Limitations of TRIX
Significant lag. The triple-smoothing process means TRIX reacts slowly to price changes. In fast-moving markets or V-shaped reversals, TRIX may confirm the new trend only after a substantial move has already occurred.
Fewer trading opportunities. TRIX's strong noise filtering means it generates far fewer signals than faster indicators. Active traders who need frequent signals may find TRIX too slow.
Not suitable as a standalone indicator. While TRIX excels at trend identification, it does not provide entry timing, overbought/oversold levels, or price targets. It must be combined with other tools for a complete trading system.
Can miss short-term moves. Short-duration trends that last only a few weeks may begin and end before TRIX generates a signal. Traders focused on short-term swings may miss opportunities while waiting for TRIX confirmation.
FAQ
What does TRIX stand for?
TRIX stands for Triple Exponential Average. The name refers to the three consecutive exponential moving averages applied to price data before the rate of change is calculated. Some sources incorrectly state it stands for "triple exponential index."
Is TRIX better than MACD?
Neither is objectively better. TRIX provides cleaner, less noisy signals and is better for identifying the primary trend with fewer false signals. MACD provides faster signals and more trading opportunities. Many professional traders use both, with TRIX for trend direction and MACD for timing.
What is the best TRIX period setting?
The default 15-period works well for most applications. Shorter periods (9-12) suit more active trading, while longer periods (18-30) suit position trading and long-term trend identification. The optimal setting depends on your trading timeframe and how many signals you want.
Can TRIX be used for day trading?
TRIX can be applied to intraday charts, but its lag makes it less suitable for short-duration day trades. On a 5-minute chart, a 15-period TRIX might confirm a move only after it has substantially occurred. If using TRIX for intraday trading, consider reducing the period to 9-12 and using it primarily as a trend filter rather than an entry trigger.
How do I add a signal line to TRIX?
Most charting platforms allow you to overlay a moving average on the TRIX indicator. Set a 9-period EMA of the TRIX line as your signal line. Buy signals occur when TRIX crosses above the signal line; sell signals occur when TRIX crosses below it.
Disclaimer
This is educational content, not financial advice. Trading involves risk, and you should consult a qualified financial advisor before making any investment decisions. Past performance does not guarantee future results.
Related Articles
12 chapters covering charts, indicators, risk management & more. Plus weekly trading insights.