Stochastic Oscillator: Overbought & Oversold Signals
⚡ Key Takeaways
- The stochastic oscillator measures where the closing price falls within the recent high-low range, expressed on a 0-100 scale
- Readings above 80 indicate overbought conditions; below 20 indicates oversold — but these are not automatic trade signals
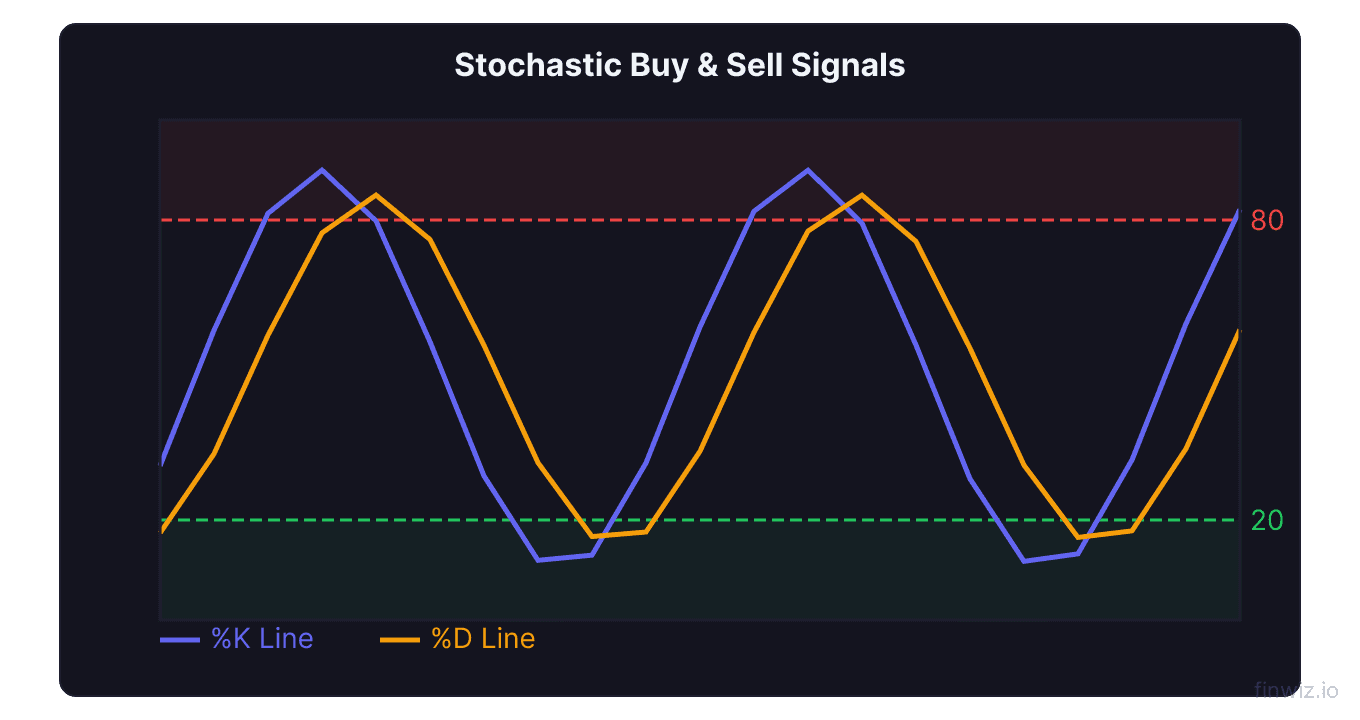
- The %K line is the main signal and %D is its moving average; crossovers between them generate buy and sell signals
- Fast stochastic uses raw %K and is very sensitive; slow stochastic smooths the data for more reliable but delayed signals
- Stochastic divergence from price is a powerful reversal signal, especially when occurring in overbought or oversold territory
What Is the Stochastic Oscillator?
The stochastic oscillator is a momentum indicator that compares a security's closing price to its price range over a specified period. Developed by George Lane in the 1950s, it is based on the observation that in uptrends, closing prices tend to cluster near the high of the range, and in downtrends, they tend to cluster near the low.
The stochastic oscillator oscillates between 0 and 100. A reading near 100 means the current close is near the top of the recent range, indicating strong upward momentum. A reading near 0 means the close is near the bottom of the range, indicating downward momentum.
The indicator is widely used by traders across all markets and timeframes. It excels at identifying overbought and oversold conditions, generating crossover signals, and detecting divergence. Compared to the RSI, the stochastic oscillator is more sensitive to price changes, making it better for short-term trading but more prone to false signals.
Stochastic Oscillator Formula
The stochastic oscillator consists of two lines: %K (the main line) and %D (the signal line).
%K = 100 x (Current Close - Lowest Low over N periods) / (Highest High over N periods - Lowest Low over N periods)The standard lookback period for %K is 14 periods. The %D line is a 3-period SMA of %K and serves as a signal line for crossover triggers.
For example, if a stock's 14-day high is $50, its 14-day low is $40, and the current close is $47, the %K value would be: 100 x (47 - 40) / (50 - 40) = 70. This means the close is 70% of the way between the recent low and recent high.
| Component | Calculation | Purpose |
|---|---|---|
| %K (Fast) | Position of close within range | Raw momentum signal |
| %D (Signal) | 3-period SMA of %K | Smoothed signal for crossovers |
Fast vs. Slow Stochastic
There are two versions of the stochastic oscillator, and the distinction between them is important for practical trading.
The fast stochastic uses the raw %K and its %D smoothing. Because %K is unsmoothed, the fast stochastic is very volatile and produces frequent signals. It can be difficult to read on a chart due to its jittery movement. The fast stochastic is best suited for traders who want the most responsive signals and can handle the noise.
The slow stochastic applies additional smoothing. The slow %K is actually the fast %D (3-period SMA of fast %K), and the slow %D is a 3-period SMA of the slow %K. This double smoothing produces a much smoother indicator that is easier to read and generates fewer false signals.
| Version | %K | %D | Sensitivity | Best For |
|---|---|---|---|---|
| Fast Stochastic | Raw %K (14-period) | 3 SMA of fast %K | High — many signals | Scalping, very short-term trading |
| Slow Stochastic | 3 SMA of fast %K | 3 SMA of slow %K | Moderate — fewer signals | Swing trading, general analysis |
Most traders use the slow stochastic because its smoothed signals are more actionable. When people refer to "the stochastic" without specifying, they typically mean the slow version. Throughout the rest of this article, references to the stochastic oscillator refer to the slow stochastic unless otherwise noted.
Pro Tip
Overbought and Oversold Signals
The stochastic oscillator uses the levels of 80 and 20 as its overbought and oversold thresholds.
Overbought (above 80): The closing price is near the top of the recent range. This suggests that buying momentum is extended and a pullback may occur. However, in strong uptrends, the stochastic can remain overbought for extended periods.
Oversold (below 20): The closing price is near the bottom of the recent range. This suggests that selling pressure may be exhausted and a bounce could occur. Like overbought readings, oversold conditions can persist in strong downtrends.
The key to successful overbought/oversold trading is waiting for the indicator to leave the extreme zone rather than acting at the moment it enters. For a buy signal, wait for the stochastic to drop below 20 and then cross back above 20. For a sell signal, wait for it to rise above 80 and then cross back below 80.
This confirmation approach significantly improves accuracy by ensuring that momentum has actually shifted before you enter a trade. Combine these signals with support and resistance analysis for even better results.
Stochastic Crossover Signals
%K and %D crossovers are the primary trading signals from the stochastic oscillator.
A bullish crossover occurs when the %K line crosses above the %D line. This is most significant when it happens in oversold territory (below 20), indicating that upward momentum is accelerating from a depressed level.
A bearish crossover occurs when the %K line crosses below the %D line. This is most significant in overbought territory (above 80), suggesting that downward momentum is beginning from an elevated level.
| Signal | Condition | Strength | Action |
|---|---|---|---|
| Strong buy | %K crosses above %D below 20 | Highest | Enter long position |
| Moderate buy | %K crosses above %D between 20-50 | Moderate | Enter long with confirmation |
| Strong sell | %K crosses below %D above 80 | Highest | Enter short or exit long |
| Moderate sell | %K crosses below %D between 50-80 | Moderate | Exit long or wait for confirmation |
Not all crossovers are equal. Crossovers near the midpoint (50) are the weakest because they indicate neither extreme momentum nor a significant reversal. Focus your attention on crossovers that occur in the overbought or oversold zones for the highest quality signals.
Stochastic Divergence
Stochastic divergence occurs when the stochastic oscillator moves in the opposite direction of price. Like RSI divergence, this is a powerful reversal signal.
Bullish divergence: Price makes a lower low, but the stochastic makes a higher low. This indicates that although price is declining, downward momentum is weakening. It often precedes a reversal to the upside.
Bearish divergence: Price makes a higher high, but the stochastic makes a lower high. Upward momentum is fading even as price pushes higher. This frequently warns of an impending decline.
Because the stochastic is more sensitive than RSI, it tends to produce divergence signals more frequently. Not all divergences lead to reversals, so confirmation from price action or other indicators is essential. The strongest divergence signals occur when the stochastic is in an extreme zone (above 80 or below 20) and price is at a key support or resistance level.
Pro Tip
Stochastic Trading Strategies
Strategy 1: Oversold Bounce in Uptrends
Identify the trend direction using the 200-day moving average. When the stock is above the 200 MA (uptrend) and the stochastic drops below 20 and then crosses back above, enter long. Place your stop below the recent swing low. Target the recent high or 2x the risk distance. This strategy buys dips within established uptrends.
Strategy 2: Overbought Rejection in Downtrends
The mirror image of Strategy 1. When the stock is below the 200 MA (downtrend) and the stochastic rises above 80 and then crosses back below, enter short. This strategy sells rallies within established downtrends, aligning overbought stochastic signals with the prevailing bearish trend.
Strategy 3: Stochastic with Bollinger Bands
Combine the stochastic oscillator with Bollinger Bands for a powerful mean-reversion system. When price touches the lower Bollinger Band and the stochastic is below 20, you have two independent oversold signals. Wait for the stochastic to cross above 20 for confirmation, then enter long targeting the middle Bollinger Band.
Strategy 4: Multi-Timeframe Stochastic
Check the weekly stochastic for the broad momentum direction and the daily stochastic for entry timing. Only take daily oversold buy signals when the weekly stochastic is above 50 (or rising). This filter ensures you are buying dips within a larger bullish momentum cycle.
Stochastic vs. RSI
Both the stochastic oscillator and RSI are momentum oscillators that identify overbought and oversold conditions, but they differ in important ways.
| Feature | Stochastic | RSI |
|---|---|---|
| What it measures | Close position within range | Magnitude of gains vs. losses |
| Sensitivity | Higher — more signals | Lower — smoother |
| Best for | Short-term trading, range-bound markets | Swing trading, trending markets |
| Divergence detection | Good but noisier | Excellent — cleaner signals |
| Overbought/Oversold levels | 80/20 | 70/30 |
| False signals | More frequent | Less frequent |
Many traders use both indicators together. RSI identifies the broader overbought or oversold condition, and the stochastic provides the precise entry timing with its crossover signal. This tandem approach combines the reliability of RSI with the responsiveness of the stochastic.
Common Stochastic Mistakes
Shorting every overbought reading. In strong uptrends, the stochastic can remain above 80 for extended periods while price continues to rise. The overbought condition reflects strong upward momentum, not an automatic sell signal. Only fade overbought readings in confirmed ranges or downtrends.
Using the fast stochastic without reason. The fast stochastic produces too many signals for most traders. Unless you are scalping and have a high-speed execution environment, the slow stochastic provides better risk-adjusted signals. The additional smoothing eliminates many false crossovers.
Ignoring the trend. Stochastic signals are most reliable when aligned with the broader trend. Oversold buy signals work best in uptrends. Overbought sell signals work best in downtrends. Counter-trend stochastic signals have lower success rates and should require additional confirmation.
Trading every crossover. Crossovers near the 50 midpoint are low-probability signals because they do not represent extreme conditions. Focus on crossovers that occur in the overbought or oversold zones for the best results.
Stochastic Settings and Optimization
The standard stochastic settings of 14, 3, 3 (lookback, %K smoothing, %D smoothing) work well for daily chart analysis. Different trading styles may benefit from adjustments.
| Trading Style | Lookback | %K Smooth | %D Smooth | Notes |
|---|---|---|---|---|
| Scalping (fast) | 5-9 | 1 | 3 | Very responsive, many signals |
| Day trading | 9-14 | 3 | 3 | Good balance for intraday |
| Swing trading | 14 | 3 | 3 | Standard — well-tested |
| Position trading | 21 | 5 | 5 | Smooth, fewer but stronger signals |
Shorter lookback periods increase sensitivity and signal frequency, while longer periods smooth the indicator and reduce false signals. The smoothing parameters (%K and %D) further control the indicator's responsiveness.
Frequently Asked Questions
What is the difference between stochastic and RSI?
The stochastic oscillator measures where the closing price falls within the recent high-low range, while RSI measures the magnitude of recent gains versus losses. The stochastic is more sensitive and produces more signals, making it better for short-term trading in range-bound markets. RSI is smoother and produces cleaner divergence signals, making it better for swing trading and trending markets. Many traders use both together — RSI for the broader view and stochastic for entry timing.
What is the best stochastic setting for day trading?
For day trading, a 9-period slow stochastic (9, 3, 3) on 5-minute or 15-minute charts provides good responsiveness without excessive noise. Some day traders prefer 14, 3, 3 on the 15-minute chart for a slightly smoother signal. Always combine intraday stochastic signals with a trend filter like VWAP or a longer moving average to avoid taking counter-trend trades in strongly directional sessions.
How reliable are stochastic crossover signals?
Stochastic crossover signals are most reliable when they occur in overbought or oversold territory and align with the broader trend direction. A bullish crossover below 20 in an uptrending market has a significantly higher success rate than a crossover near 50 in a trendless market. Studies show that filtered stochastic crossovers (using trend direction and extreme readings) can achieve win rates of 55-65%, while unfiltered crossovers may only achieve 40-50%. Always use additional confirmation to improve your odds.
Can the stochastic be used for swing trading?
Yes, the stochastic oscillator is effective for swing trading, particularly on daily charts with the standard 14, 3, 3 settings. Look for the stochastic to reach oversold territory (below 20) during pullbacks in an uptrend, then enter when %K crosses above %D. The swing trade typically lasts until the stochastic reaches overbought territory or price hits resistance. The slow stochastic provides smoother signals that align well with the multi-day holding period of swing trades.
What does it mean when the stochastic stays overbought?
When the stochastic remains in overbought territory (above 80) for an extended period, it indicates a very strong uptrend. This is actually a bullish sign, not a bearish one. Sustained overbought readings mean the closing price consistently lands near the top of the range, which is the hallmark of a powerful trend. Selling simply because the stochastic is overbought in this context leads to missed profits. Wait for the stochastic to actually drop below 80 before considering any bearish action, and only then if the broader trend context supports it.
Disclaimer
This is educational content, not financial advice. Trading involves risk, and you should consult a qualified financial advisor before making any investment decisions. Past performance does not guarantee future results.
Related Articles
12 chapters covering charts, indicators, risk management & more. Plus weekly trading insights.