Elliott Wave Theory: How to Count Waves & Trade Them
⚡ Key Takeaways
- Elliott Wave Theory identifies repeating fractal price patterns consisting of 5-wave impulse moves in the direction of the trend and 3-wave corrective moves against it
- The three unbreakable rules are: Wave 2 cannot retrace beyond the start of Wave 1, Wave 3 is never the shortest impulse wave, and Wave 4 cannot overlap the price territory of Wave 1
- Fibonacci ratios provide specific price targets for each wave: Wave 3 commonly extends 1.618x Wave 1, and Wave 2 typically retraces 50-61.8% of Wave 1
- Wave patterns exist at multiple degrees (from Grand Supercycle spanning centuries to Subminuette spanning minutes), creating a fractal market structure
- Elliott Wave analysis is highly subjective, and even experienced practitioners frequently disagree on wave counts, making it one of the most debated methods in technical analysis
What Is Elliott Wave Theory?
Elliott Wave Theory is a method of technical analysis that identifies recurring fractal wave patterns in financial market prices. Developed by Ralph Nelson Elliott in the 1930s, the theory proposes that market prices unfold in specific patterns driven by investor psychology, alternating between periods of optimism and pessimism in predictable wave structures.
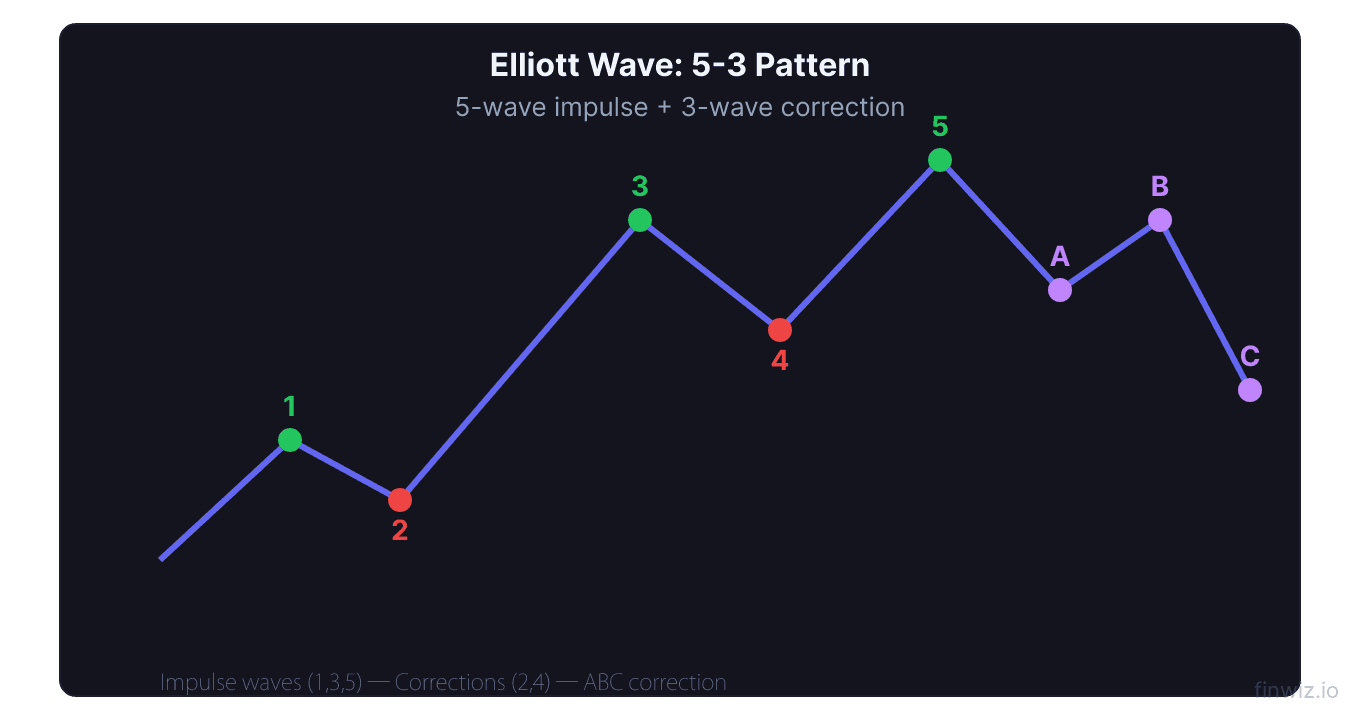
The core principle is straightforward: markets move in a pattern of five waves in the direction of the main trend (called impulse waves), followed by three waves against the trend (called corrective waves). This 5-3 pattern forms the basic building block of all Elliott Wave analysis.
Elliott discovered these patterns by studying 75 years of stock market data, including yearly, monthly, weekly, daily, and even hourly charts. He found that the same patterns appeared at every timeframe, creating a fractal structure where each wave contains smaller waves of the same pattern, and each wave is part of a larger wave of the same pattern.
The theory gained mainstream popularity after Robert Prechter published his book "Elliott Wave Principle" in 1978 and successfully called the 1980s bull market. Today, Elliott Wave analysis remains one of the most debated and divisive approaches in technical analysis.
The 5-Wave Impulse Pattern
The impulse wave is the primary directional move in the market. In an uptrend, the impulse consists of five waves labeled 1 through 5. Three of these waves (1, 3, and 5) move in the direction of the trend, while two waves (2 and 4) are corrective moves against the trend.
Wave 1: The Initial Move
Wave 1 begins a new trend direction. It is often the hardest wave to identify in real-time because it looks like just another rally within the previous downtrend. Volume is typically moderate, and few traders recognize that a new trend is starting. Fundamentally, news is usually still negative during Wave 1.
Wave 2: The First Correction
Wave 2 retraces a portion of Wave 1's advance. It is driven by traders who believe the previous downtrend is resuming. Wave 2 often retraces 50% to 61.8% of Wave 1, and sometimes even deeper to 78.6%. The critical rule is that Wave 2 can never retrace beyond the starting point of Wave 1. If it does, the wave count is invalid.
Wave 2 corrections tend to be sharp and fast, often forming zigzag patterns. Volume should decrease during Wave 2, indicating declining selling pressure.
Wave 2 Retracement Targets:Wave 3: The Powerhouse
Wave 3 is typically the longest and strongest of the five impulse waves. It is never the shortest impulse wave (this is an unbreakable rule). Wave 3 is where the majority of participants recognize the new trend and pile in. Volume expands significantly, gaps form, and the move often exceeds expectations.
Fundamentally, economic data and corporate earnings begin confirming the trend during Wave 3. Moving average crossovers like the golden cross often occur during this wave, and MACD readings reach their most extreme levels.
Wave 3 commonly extends to 1.618 times the length of Wave 1, measured from Wave 2's end. In strongly trending markets, Wave 3 can extend to 2.618 or even 4.236 times Wave 1.
Wave 3 Price Targets:Wave 4: The Second Correction
Wave 4 is a corrective wave that tends to be more complex and time-consuming than Wave 2. Where Wave 2 is typically sharp and deep, Wave 4 tends to be sideways and shallow, often forming triangles, flats, or complex combinations.
The critical rule for Wave 4 is that it cannot overlap the price territory of Wave 1. Specifically, the low of Wave 4 cannot drop below the high of Wave 1. This rule applies in cash markets but is relaxed in futures markets due to leverage-driven volatility.
Wave 4 typically retraces 38.2% of Wave 3, though it can retrace up to 50%.
Pro Tip
Wave 5: The Final Push
Wave 5 is the final leg of the impulse move. It often occurs with declining momentum, as evidenced by divergences between price (making new highs) and oscillators like RSI and MACD (making lower highs). Volume in Wave 5 is usually lower than in Wave 3.
Wave 5 typically equals Wave 1 in length, or it extends to 0.618 or 1.618 times Wave 1's length. In some cases, Wave 5 can "truncate" or "fail," where it does not exceed the high of Wave 3. Truncated fifth waves usually indicate extreme weakness and are often followed by sharp reversals.
Wave 5 Price Targets:The Three Unbreakable Rules
Elliott Wave Theory has three absolute rules that can never be violated. If any rule is broken, the wave count is wrong and must be revised.
Rule 1: Wave 2 cannot retrace more than 100% of Wave 1. The end of Wave 2 must remain above (in an uptrend) or below (in a downtrend) the starting point of Wave 1.
Rule 2: Wave 3 can never be the shortest impulse wave. Among Waves 1, 3, and 5, Wave 3 must be longer than at least one of the other two. In practice, Wave 3 is usually the longest of all three.
Rule 3: Wave 4 cannot overlap the price territory of Wave 1. The low of Wave 4 cannot enter the price range of Wave 1. In an uptrend, this means Wave 4's low must stay above Wave 1's high.
In addition to these rules, there are several guidelines (not rules) that help practitioners identify waves:
- Waves 2 and 4 tend to alternate in form (sharp vs. flat)
- Wave 3 usually has the highest volume
- Wave 5 often shows momentum divergences
- Corrective waves tend to retrace to the prior fourth wave of one lesser degree
The 3-Wave Corrective Pattern (A-B-C)
After a five-wave impulse completes, a three-wave correction follows, labeled A, B, and C. Corrective waves are more varied and complex than impulse waves, making them significantly harder to analyze in real-time.
Wave A: The Initial Decline
Wave A begins the correction against the main trend. During Wave A, most participants still believe the trend is intact and view the decline as a buying opportunity. Volume begins to increase on the downside.
Wave B: The False Hope
Wave B is a counter-trend rally within the correction. It often tricks traders into thinking the previous trend has resumed. Wave B can retrace up to 100% of Wave A (and even slightly beyond in some patterns), creating the illusion that the uptrend is intact. Volume during Wave B is typically lower than Wave A.
Wave C: The Full Correction
Wave C completes the corrective structure. It is typically the most damaging wave for those who bought during Wave B, as it often extends beyond the low of Wave A. Wave C commonly equals Wave A in length or extends to 1.618 times Wave A.
Corrective Wave Targets:Types of Corrective Patterns
Corrections come in several recognized forms, adding complexity to Elliott Wave analysis.
Zigzag (5-3-5)
A zigzag is a sharp, steep correction labeled A-B-C where Wave A and Wave C are both impulse waves (five sub-waves each) and Wave B is a corrective wave (three sub-waves). In a zigzag, Wave B retraces a relatively small portion of Wave A, and Wave C extends well beyond Wave A's endpoint.
Flat (3-3-5)
A flat correction is a sideways pattern where Waves A and B are both three-wave structures and Wave C is a five-wave structure. In a regular flat, Wave B retraces nearly all of Wave A, and Wave C ends near Wave A's endpoint. In an expanded flat, Wave B exceeds the start of Wave A, and Wave C extends beyond the end of Wave A.
Triangle (3-3-3-3-3)
A triangle is a converging sideways pattern with five waves labeled A-B-C-D-E, each consisting of three sub-waves. Triangles typically appear in the Wave 4 position or in Wave B of a correction. They indicate a pause before the final wave in the direction of the larger trend.
Combinations
Complex corrections combine two or three simple corrective patterns (zigzags, flats, triangles) connected by intervening waves labeled X. These double and triple combinations (WXY or WXYXZ) are the most difficult patterns to identify and are where many wave counts go wrong.
Fibonacci Ratios in Elliott Wave
Fibonacci ratios are integral to Elliott Wave analysis. Elliott Wave practitioners use Fibonacci retracements and extensions to project price targets for each wave.
The key Fibonacci ratios used in Elliott Wave analysis are:
| Fibonacci Ratio | Common Application |
|---|---|
| 0.236 (23.6%) | Shallow Wave 4 retracement |
| 0.382 (38.2%) | Wave 4 retracement, minimum correction target |
| 0.500 (50.0%) | Wave 2 retracement, correction midpoint |
| 0.618 (61.8%) | Deep Wave 2 retracement, Wave 5 extension |
| 0.786 (78.6%) | Maximum Wave 2 retracement before invalidation |
| 1.000 (100%) | Wave C = Wave A, Wave 5 = Wave 1 |
| 1.618 (161.8%) | Wave 3 extension target, Wave C extended target |
| 2.618 (261.8%) | Wave 3 strong extension |
The mathematical connection between Elliott Wave patterns and Fibonacci ratios is one of the theory's most compelling aspects. The number of waves in a complete cycle (5 impulse + 3 corrective = 8 total) and the number of sub-waves (21, 34, 55, 89) are all Fibonacci numbers.
Pro Tip
Wave Degrees
Elliott Wave patterns exist at multiple degrees, or timeframes, creating a fractal structure. Each wave in a larger pattern contains waves of a smaller degree, and each pattern is part of a wave in a larger degree pattern.
Elliott identified nine degrees of waves:
| Degree | Typical Duration | Chart |
|---|---|---|
| Grand Supercycle | Multiple centuries | Yearly |
| Supercycle | Multiple decades (40-70 years) | Yearly/Monthly |
| Cycle | 1 to several years | Monthly/Weekly |
| Primary | Months to years | Weekly/Daily |
| Intermediate | Weeks to months | Daily |
| Minor | Weeks | Daily/4-Hour |
| Minute | Days | Hourly |
| Minuette | Hours | 15-Minute |
| Subminuette | Minutes | 5-Minute/1-Minute |
Each Wave 1 at the Primary degree, for example, contains five waves at the Intermediate degree. And each of those Intermediate waves contains waves at the Minor degree. This fractal nature means that the same analytical approach works on a 5-minute chart for a day trader and a monthly chart for a long-term investor.
How to Count Waves in Practice
Counting waves in real-time is the most challenging aspect of Elliott Wave analysis. Here is a practical approach.
Step 1: Identify the larger trend. Determine whether the market is in a bullish or bearish cycle at the higher timeframe. Use the 200-day moving average as a reference point for the primary trend direction.
Step 2: Find the most obvious impulse. Look for the clearest five-wave structure. Wave 3 is usually the most recognizable because of its length and momentum. Start by identifying Wave 3 and then work backward to find Waves 1 and 2, and forward to find Waves 4 and 5.
Step 3: Verify the rules. Check that all three unbreakable rules are satisfied. If any rule is violated, your count is wrong and needs revision.
Step 4: Apply Fibonacci levels. Use Fibonacci retracement levels to confirm wave boundaries. If Wave 2 retraces exactly to the 61.8% level and Wave 4 retraces to the 38.2% level, your count gains confidence.
Step 5: Consider alternatives. Always maintain at least one alternative wave count. If the primary count is invalidated, you can quickly switch to the alternate without losing your bearings.
Real-World Example: S&P 500 2009-2020
One of the clearest Elliott Wave patterns in recent history played out on the S&P 500 from the March 2009 low to the February 2020 high.
Wave 1 (March 2009 to April 2010): The initial rally from 666 to approximately 1,220, a 83% gain. Most participants were skeptical, viewing it as a bear market rally.
Wave 2 (April 2010 to October 2011): A complex correction that retraced approximately 38% of Wave 1, with the S&P touching 1,074 during the European debt crisis and US credit downgrade.
Wave 3 (October 2011 to January 2018): The longest and strongest wave, carrying the index from 1,074 to approximately 2,873. This represented the "sweet spot" of the bull market where economic recovery was broadly recognized.
Wave 4 (January 2018 to December 2018): A complex correction involving trade war fears, Fed rate hikes, and the Q4 2018 selloff. The S&P 500 bottomed at 2,346, retracing approximately 29% of Wave 3. Notably, Wave 4 did not overlap Wave 1 territory (1,220), satisfying the rule.
Wave 5 (December 2018 to February 2020): The final push to 3,386, occurring with declining breadth and momentum divergences on RSI and MACD, classic Wave 5 behavior.
The subsequent A-B-C correction played out as: Wave A (the COVID crash to 2,191), Wave B (the partial recovery), and Wave C completing the corrective structure.
Limitations and Criticisms
Elliott Wave Theory faces significant criticism, and understanding its limitations is essential for any practitioner.
Subjectivity is the primary criticism. Two experienced Elliott Wave analysts can look at the same chart and arrive at completely different wave counts. There is no objective, algorithmic way to count waves, making it as much art as science.
Hindsight bias plagues Elliott Wave analysis. Wave counts are often clearest after the fact. In real-time, it is common for a count to be revised multiple times as new price data arrives. Some critics argue that the theory is essentially unfalsifiable because any price action can be explained by adjusting the count.
Corrective patterns are extremely difficult to analyze. While impulse waves follow relatively clear rules, corrective waves can take dozens of different forms. Complex corrections involving combinations of zigzags, flats, and triangles can be practically impossible to identify until they are complete.
The theory does not specify timing. Elliott Wave tells you the expected pattern of price movement but provides no information about when each wave will begin or end. A Wave 2 correction could last two days or two months.
Despite these limitations, many traders find value in the framework's emphasis on market structure, its integration with Fibonacci mathematics, and its ability to provide both price targets and invalidation levels for trade planning.
Combining Elliott Wave with Other Analysis
Elliott Wave analysis works best when combined with other technical tools.
Momentum indicators: Use RSI and MACD divergences to confirm Wave 5 completions. Momentum typically peaks in Wave 3, so declining momentum during a new price high supports the Wave 5 interpretation.
Volume analysis: Volume should expand during Wave 3 and contract during Wave 5. If volume is increasing during what you think is Wave 5, it may actually be a Wave 3 extension.
Fibonacci tools: Fibonacci retracements and extensions provide specific price targets for each wave, adding precision to the otherwise subjective wave count.
Support and resistance: Traditional support and resistance levels can help confirm wave boundaries. Wave 4 lows often align with prior support levels.
Bollinger Bands: Band width often contracts during Wave 4 triangles and expands during Wave 3 and Wave 5 impulses, providing additional confirmation.
FAQ
How accurate is Elliott Wave Theory?
Accuracy depends heavily on the practitioner's skill and experience. Even experts frequently disagree on wave counts. The theory is most useful for providing a framework of possibilities rather than precise predictions. Always maintain alternative counts and use stop losses based on rule violations.
Can beginners use Elliott Wave effectively?
Elliott Wave has one of the steepest learning curves in technical analysis. Beginners should start by learning to identify basic five-wave impulse patterns on historical charts before attempting real-time analysis. Expect the learning process to take months or years of practice.
Which markets work best for Elliott Wave analysis?
Elliott Wave works best on liquid, widely-traded markets where crowd psychology drives price action. Major stock indices, forex pairs, and commodities like gold and oil tend to produce the clearest wave patterns. Thinly traded or heavily manipulated markets are more difficult to analyze.
How do I know when my wave count is wrong?
Your wave count is definitively wrong if any of the three rules are violated: Wave 2 retraces beyond Wave 1's origin, Wave 3 is the shortest impulse wave, or Wave 4 overlaps Wave 1's price territory. When a rule is broken, you must revise your count.
Can software count Elliott Waves automatically?
Several software programs attempt to automate wave counting, but none produce consistently reliable results. The subjective nature of the theory makes full automation extremely difficult. Most experienced practitioners use software for Fibonacci calculations and pattern suggestions but rely on human judgment for the final wave count.
What is the difference between Elliott Wave and other cycle theories?
Elliott Wave focuses on fractal wave patterns driven by psychology, while other cycle theories (like Kondratiev waves or Hurst cycles) focus on time-based cycles. Elliott Wave's unique contribution is the specific structural rules (the three unbreakable rules) and the integration of Fibonacci mathematics into price pattern analysis.
Disclaimer
This is educational content, not financial advice. Trading involves risk, and you should consult a qualified financial advisor before making any investment decisions. Past performance does not guarantee future results.
Related Articles
12 chapters covering charts, indicators, risk management & more. Plus weekly trading insights.