ATR (Average True Range): Measuring Volatility for Better Stops
⚡ Key Takeaways
- ATR (Average True Range) measures market volatility by calculating the average range of price movement over a specified period
- ATR does not indicate trend direction — it only measures how much price is moving, making it ideal for stop-loss placement and position sizing
- A common stop-loss method is placing stops 1.5 to 3 ATR away from the entry price, adapting automatically to current volatility
- Rising ATR indicates increasing volatility (often at trend beginnings or breakouts); falling ATR signals decreasing volatility (consolidation)
- The standard ATR period is 14, though day traders often use shorter periods like 7 or 10 for more responsive readings
What Is ATR (Average True Range)?
The Average True Range (ATR) is a volatility indicator developed by J. Welles Wilder Jr. and introduced in his 1978 book New Concepts in Technical Trading Systems. Unlike most technical indicators that measure price direction or momentum, ATR focuses exclusively on measuring how much an asset's price moves — its volatility.
ATR does not tell you whether price is going up or down. Instead, it tells you how much price is moving on average during each period. This information is invaluable for setting appropriate stop-loss levels, calculating position sizes, and identifying changes in market behavior.
The indicator is displayed as a single line below the price chart, with higher values indicating greater volatility and lower values indicating calmer markets. ATR is measured in price units (dollars for stocks, pips for forex), making it directly applicable to trade management decisions.
True Range and ATR Calculation
ATR is built on the concept of True Range, which captures the full extent of price movement including any gaps between sessions.
True Range = Maximum of:The True Range formula accounts for three scenarios. The first measures the normal intraday range. The second captures upward gaps where today's high is above yesterday's close. The third captures downward gaps where today's low is below yesterday's close.
By taking the maximum of these three values, True Range ensures that gap moves are included in the volatility measurement. This is critical because a stock that gaps down 5% has exhibited significant volatility, even if its intraday range on that day was narrow.
| True Range Component | What It Captures | When It Is the Largest |
|---|---|---|
| High minus Low | Normal intraday range | Regular trading days |
| High minus Previous Close | Upward gap volatility | Gap up opens |
| Low minus Previous Close | Downward gap volatility | Gap down opens |
The ATR itself is simply a moving average of the True Range values over N periods. Wilder used a specific smoothing method similar to an exponential average, but many platforms calculate it as a simple or exponential moving average. The standard period is 14.
Using ATR for Stop-Loss Placement
The most practical application of ATR is setting volatility-adjusted stop-losses. Instead of using arbitrary dollar amounts or fixed percentages, ATR-based stops adapt to the current market environment.
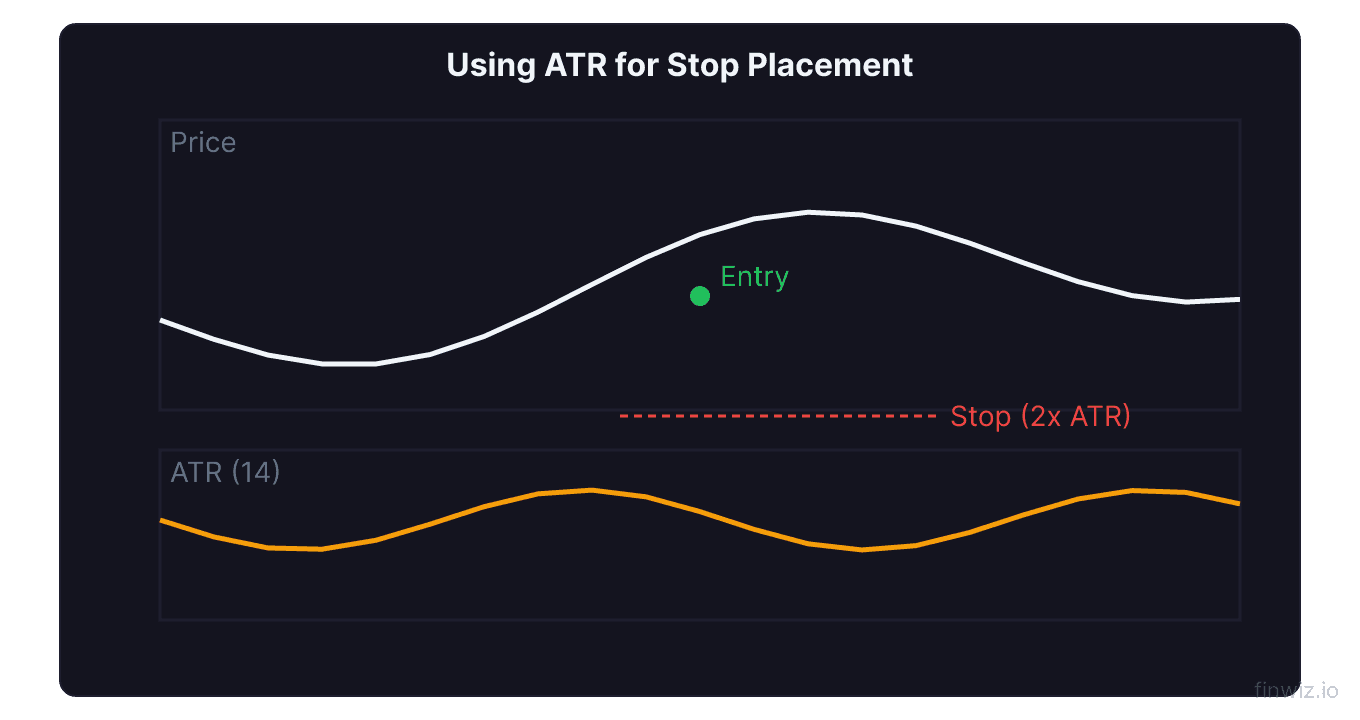
The concept is simple: in volatile markets, you need wider stops to avoid being stopped out by normal fluctuations. In calm markets, you can use tighter stops because price swings are smaller. ATR quantifies this automatically.
The ATR multiple method works as follows. Multiply the current ATR value by a factor (typically 1.5 to 3) and subtract that from your entry price for a long trade, or add it for a short trade.
Long Stop = Entry Price - (ATR x Multiplier)| ATR Multiple | Risk Level | Best For |
|---|---|---|
| 1.0 ATR | Tight — high chance of being stopped out | Scalping, very short-term trades |
| 1.5 ATR | Moderate-tight | Day trading |
| 2.0 ATR | Standard | Swing trading |
| 3.0 ATR | Wide — low chance of premature stop | Position trading, volatile stocks |
For example, if you buy a stock at $100 and the 14-period ATR is $2.50, a 2x ATR stop would be placed at $95 (100 - 2.50 x 2). If the stock's volatility increases and ATR rises to $4.00, your next trade's stop would be placed at $92 (100 - 4.00 x 2). The stop automatically adapts to conditions.
Pro Tip
Position Sizing with ATR
ATR is equally powerful for position sizing — determining how many shares or contracts to trade based on your risk tolerance.
The logic is straightforward. If you risk a fixed dollar amount per trade (say $500), and your ATR-based stop is 2 ATR from entry, you can calculate the exact position size that limits your risk to that amount.
Position Size = Dollar Risk per Trade / (ATR x Multiplier)This approach ensures that your dollar risk remains consistent regardless of the stock's volatility. A volatile stock with a high ATR will result in a smaller position size, while a calm stock with a low ATR will allow a larger position. This volatility-normalized position sizing is used by many professional traders and fund managers.
The benefit is significant. Without ATR-based sizing, a trader might buy the same number of shares in a calm utility stock and a volatile tech stock, taking on dramatically different risk levels. ATR sizing equalizes the risk across all trades, leading to more consistent portfolio performance.
ATR as a Volatility Filter
Beyond stop-loss and position sizing, ATR serves as a powerful volatility filter for your trading strategies.
Breakout confirmation: When price breaks out of a consolidation pattern, check whether ATR is expanding. A breakout accompanied by rising ATR is more likely to sustain because it shows increasing participation and conviction. A breakout with flat or declining ATR may be a false move that quickly reverses. This concept works well with Bollinger Band squeeze breakouts and support and resistance breaks.
Trend maturity: In the early stages of a trend, ATR typically rises as volatility increases with the new directional move. As the trend matures, ATR often begins to decline, suggesting that the easy portion of the move is over. When ATR drops significantly from its peak during a trend, it can signal that a consolidation or reversal is approaching.
Market regime identification: Comparing the current ATR to its historical average tells you whether the market is in a high-volatility or low-volatility regime. Low ATR relative to history suggests that a volatility expansion is likely, while high ATR suggests that the volatile phase may be nearing its end.
Pro Tip
ATR Settings and Timeframes
The standard ATR period is 14, but different trading styles benefit from different settings.
| Setting | Period | Responsiveness | Best Use |
|---|---|---|---|
| Short-term | 5-7 | Very responsive, captures recent volatility shifts | Day trading, scalping |
| Standard | 14 | Balanced | Swing trading, general analysis |
| Long-term | 20-50 | Smooth, shows broader volatility cycles | Position trading, regime identification |
Day traders often prefer shorter ATR periods (7 or 10) on intraday charts. A 10-period ATR on a 5-minute chart captures the volatility of the last 50 minutes, which is relevant for intraday stop placement. Pair this with VWAP for intraday trade management.
Swing traders use the standard 14-period ATR on daily charts. This captures two weeks of volatility data and provides stable, reliable readings for multi-day trade management.
Position traders may use a 20 or even 50-period ATR to smooth out daily volatility fluctuations and focus on the broader volatility environment. This longer-term view helps with portfolio-level risk management.
ATR in Combination with Other Indicators
ATR enhances virtually any trading system by adding a volatility dimension that most indicators lack.
ATR + Moving Averages: Use moving averages for trend direction and ATR for stop placement. Enter on a moving average bounce and set your stop at 2 ATR below the moving average. This combination aligns trend-following entries with volatility-adjusted risk management.
ATR + RSI: When RSI reaches an extreme reading and ATR is elevated, the reversal signal is occurring in a high-volatility environment. This means the potential move is larger but so is the risk. Adjust your position size downward using ATR to compensate for the increased volatility.
ATR + Keltner Channels: Keltner Channels are actually built on ATR, using it to create volatility bands around a moving average. Understanding ATR helps you interpret Keltner Channel signals more effectively.
ATR + Parabolic SAR: The Parabolic SAR generates trailing stops, and ATR can validate whether those stops are appropriately spaced for current volatility. If the Parabolic SAR stop is tighter than 1 ATR, it may be too close and prone to premature triggering.
Common ATR Mistakes
Using ATR as a directional indicator. ATR measures volatility, not direction. A rising ATR does not mean prices are going up — it means prices are moving more in either direction. Always use a separate indicator for trend direction.
Fixed ATR multiples for all stocks. While 2x ATR is a common stop multiple, some stocks and markets may require adjustment. Very liquid, mean-reverting stocks might work with 1.5x ATR, while trending commodities might need 3x ATR. Backtest your ATR multiple on your specific market.
Ignoring ATR for position sizing. Many traders use ATR for stops but forget to adjust their position sizes accordingly. An ATR-based stop is only part of the equation. ATR-based position sizing completes the risk management framework.
Not considering the ATR trend. A single ATR reading is less informative than the trend of ATR. If ATR has been rising for several days, volatility is expanding, and conditions are different from when ATR is stable or declining. Track the direction of ATR, not just its value.
ATR-Based Trading Systems
Several well-known trading systems rely on ATR for key decisions.
The Turtle Trading System used ATR (which they called N) for both position sizing and stop placement. Each position was sized so that a 2N (2 ATR) move against the trade equaled 1% of account equity. Stops were placed at 2N from entry. This system produced legendary returns in the 1980s and demonstrates the power of ATR-based risk management.
The Keltner Channel breakout system uses ATR to define channel widths and triggers trades when price breaks outside the channel. Combined with momentum confirmation from MACD or ADX, this creates a robust trend-following system.
Volatility breakout systems enter trades when the daily range exceeds a multiple of ATR, indicating that a significant directional move is underway. These systems capture explosive moves while staying out of choppy, low-volatility environments.
Frequently Asked Questions
What is a good ATR value?
There is no universally good or bad ATR value because ATR is relative to the price of the instrument. A $200 stock with a $4 ATR has the same relative volatility as a $50 stock with a $1 ATR (both are 2%). To compare volatility across different instruments, divide ATR by the stock price to get a percentage. This normalized ATR allows you to compare volatility between a $10 stock and a $500 stock on equal footing.
How do you use ATR for day trading?
For day trading, use a shorter ATR period (7-10) on your intraday chart (typically 5-minute or 15-minute). Calculate your stop as 1 to 1.5 ATR from your entry point. Use the ATR value to calculate position size so that your maximum loss per trade is a fixed percentage of your account. Additionally, compare the current ATR to the daily average ATR — if intraday ATR is significantly above the daily average, the market is unusually volatile and you should reduce position sizes.
Is ATR better than a percentage-based stop?
ATR-based stops are generally superior to fixed percentage stops because they adapt to current market conditions. A 2% stop might be perfect for a calm market but get triggered by normal noise in a volatile market. ATR automatically accounts for this by expanding stops when volatility is high and contracting them when volatility is low. The exception is for very long-term investors who may prefer simple percentage-based stops for portfolio management simplicity.
Can ATR predict breakouts?
ATR itself does not predict breakouts, but low ATR readings relative to the historical average often precede breakouts. When ATR contracts to unusually low levels, it indicates that the market is in a period of compression. Because volatility is cyclical, this compression typically resolves with an expansion — a breakout. Combine low ATR readings with pattern analysis and the Bollinger Band squeeze to identify the highest probability breakout setups.
What is the difference between ATR and standard deviation?
Both ATR and standard deviation measure volatility, but they do it differently. Standard deviation measures how far prices deviate from their average, while ATR measures the average size of price bars including gaps. ATR is more responsive to sudden volatility changes (like gap openings) because it directly measures range. Standard deviation is better for statistical analysis and is the basis for Bollinger Bands. In practice, both produce similar volatility readings most of the time, but ATR captures gap risk more effectively.
Disclaimer
This is educational content, not financial advice. Trading involves risk, and you should consult a qualified financial advisor before making any investment decisions. Past performance does not guarantee future results.
12 chapters covering charts, indicators, risk management & more. Plus weekly trading insights.