Golden Cross: The Bullish Signal Every Trader Watches
⚡ Key Takeaways
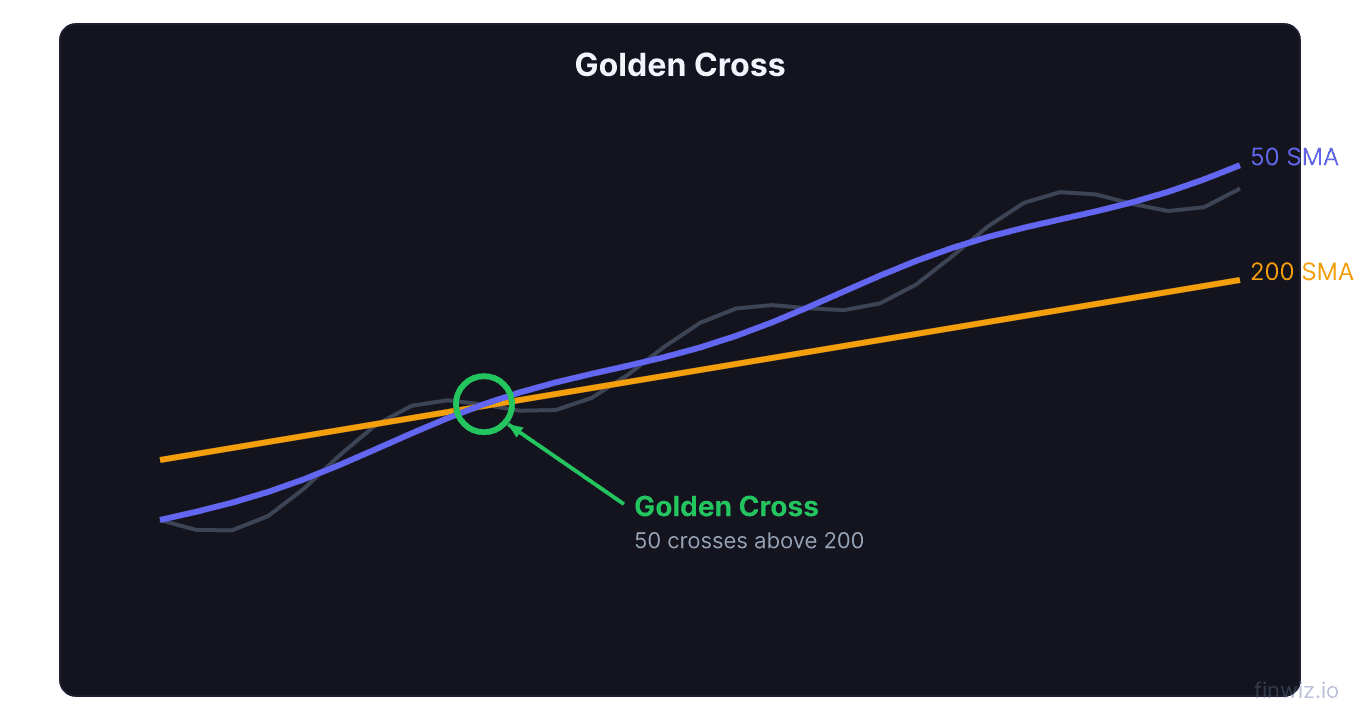
- A golden cross occurs when the 50-day moving average crosses above the 200-day moving average, signaling a potential long-term bullish trend
- Historical data shows golden crosses on the S&P 500 have preceded positive 12-month returns roughly 73% of the time since 1950
- The three stages of a golden cross are downtrend flattening, crossover, and confirmation through sustained uptrend
- Golden crosses work best as confirmation signals rather than entry signals, since much of the move has often already occurred by the time the cross forms
- Combining a golden cross with volume confirmation and other indicators like RSI significantly improves reliability
What Is a Golden Cross?
A golden cross is a bullish technical chart pattern that occurs when a short-term moving average crosses above a long-term moving average. The most widely recognized version uses the 50-day simple moving average (SMA) crossing above the 200-day SMA. When this crossover happens, it signals that recent price momentum has shifted to the upside and that a longer-term uptrend may be developing.
The golden cross is the opposite of the death cross, which signals bearish momentum when the 50-day SMA falls below the 200-day SMA. Together, these two crossover patterns form one of the most watched pair of signals in technical analysis.
Traders and investors monitor golden crosses because they have historically preceded sustained rallies in major indices and individual stocks. However, like all technical signals, the golden cross is not infallible and requires proper context for effective use.
The Three Stages of a Golden Cross
Every golden cross develops through three distinct stages. Understanding each stage helps you anticipate the signal and position accordingly.
Stage 1: Downtrend Bottoming Out. The stock or index has been in a downtrend, with the 50-day SMA below the 200-day SMA. Selling pressure begins to weaken, and the price starts to stabilize or form a base. The 50-day SMA begins flattening and then curving upward as recent prices improve.
Stage 2: The Crossover. The 50-day SMA crosses above the 200-day SMA. This is the actual golden cross event. Volume typically increases during this stage as more buyers enter the market, recognizing the shift in momentum.
Stage 3: Uptrend Confirmation. After the crossover, the 50-day SMA continues to rise and remains above the 200-day SMA. Both moving averages begin sloping upward, confirming that the new uptrend has established itself. The 200-day SMA now acts as a support level during pullbacks.
Pro Tip
Historical Win Rate and Performance Data
The golden cross has a well-documented track record across major market indices. Here is what historical data reveals about its reliability.
On the S&P 500, golden crosses since 1950 have been followed by positive returns over the next 12 months approximately 73% of the time. The average gain in the year following a golden cross has been roughly 10-15%, though individual outcomes vary widely.
| Period After Golden Cross | Average Return (S&P 500) | Win Rate |
|---|---|---|
| 1 month | +1.5% | 64% |
| 3 months | +4.2% | 69% |
| 6 months | +7.8% | 71% |
| 12 months | +12.4% | 73% |
Notable golden cross examples:
- March 2009: The S&P 500 formed a golden cross in June 2009, roughly three months after the financial crisis bottom. The index gained over 20% in the following 12 months and continued rallying for years.
- April 2020: After the COVID crash, the S&P 500 formed a golden cross in July 2020. The index surged more than 25% over the next year.
- March 2023: A golden cross formed on the S&P 500, preceding a strong rally through the end of the year with gains exceeding 15%.
How to Trade the Golden Cross
There are several approaches to trading a golden cross, ranging from simple to more sophisticated.
The Basic Entry
The simplest approach is to buy when the 50-day SMA crosses above the 200-day SMA and hold until a death cross forms. This is a pure trend-following strategy. Your stop loss sits below the 200-day SMA, giving the trade room to breathe.
The Pullback Entry
Many experienced traders wait for the golden cross to form and then enter on the first pullback to the 50-day SMA. This offers a better risk-to-reward ratio because you are buying at a lower price than the crossover point while still trading in the direction of the confirmed uptrend.
Volume-Confirmed Entry
A golden cross accompanied by a significant increase in trading volume carries more weight than one formed on low volume. High volume at the crossover point indicates genuine buying conviction rather than a technical artifact of price averaging.
50-Day SMA = Sum of last 50 closing prices / 50Using EMA Instead of SMA
Some traders substitute exponential moving averages (EMAs) for simple moving averages. EMAs give more weight to recent prices, so the crossover occurs sooner. This creates earlier signals but also more false positives. The choice between SMA and EMA depends on whether you prioritize speed or reliability.
When the Golden Cross Fails
Not every golden cross leads to a sustained rally. Understanding when and why the signal fails helps you manage risk.
Choppy, range-bound markets produce the most golden cross failures. When a stock or index oscillates back and forth without establishing a clear trend, the moving averages repeatedly cross each other, generating whipsaw signals. This is known as a "death cross-golden cross chop zone," and it can be costly for traders who act on each crossover.
Late signals in strong V-recoveries can also disappoint. Because the golden cross relies on a 50-day and 200-day average, it is inherently a lagging indicator. In a sharp V-shaped recovery, much of the rally may already be complete by the time the golden cross forms. The 2020 COVID recovery demonstrated this: stocks had already rebounded significantly from the March lows before the golden cross appeared in July.
Bear market rallies can generate golden crosses that ultimately fail. During the 2001-2002 bear market, the S&P 500 formed golden crosses that reversed back into death crosses as the broader downtrend resumed.
Improving Golden Cross Signals with Filters
You can improve the reliability of golden cross signals by adding confirmation filters.
RSI confirmation: Check that the RSI is above 50 but below 70 when the golden cross forms. An RSI already in overbought territory (above 70) suggests the move may be exhausted.
ADX filter: An ADX reading above 20 at the time of the golden cross confirms that a trend is developing, not just random noise.
Volume confirmation: Require that volume on the crossover day or week exceeds the 20-day average volume. This ensures there is real participation behind the move.
Sector confirmation: A golden cross on an individual stock is more reliable when the stock's sector ETF also shows bullish moving average positioning.
Pro Tip
Golden Cross on Different Timeframes
While the 50-day and 200-day crossover on the daily chart is the standard golden cross, the concept applies to any timeframe.
Weekly charts: The 10-week SMA crossing above the 40-week SMA produces a slower but more reliable signal suitable for long-term investors. False signals are rarer on weekly charts.
Intraday charts: Day traders sometimes watch for 50-period and 200-period SMA crossovers on 5-minute or 15-minute charts. These intraday golden crosses can identify momentum shifts during the trading day but generate many more false signals.
Customized periods: Some traders use the 20-day and 50-day crossover for more responsive signals, or the 100-day and 200-day crossover for longer-term confirmation. The key principle remains the same: a shorter-term average crossing above a longer-term average signals bullish momentum.
Golden Cross vs. Other Technical Signals
The golden cross is one of many trend-confirmation tools. Understanding how it compares to alternatives helps you build a complete trading approach.
| Signal | Speed | Reliability | Best For |
|---|---|---|---|
| Golden Cross (50/200 SMA) | Slow | High | Long-term trend identification |
| MACD Signal Line Crossover | Medium | Medium | Momentum confirmation |
| Bollinger Band Breakout | Fast | Lower | Volatility expansion |
| Ichimoku Cloud Breakout | Medium | High | Multi-factor trend confirmation |
The golden cross is best used alongside faster indicators. A common approach is to use MACD for timing and the golden cross for directional bias. When both align, the probability of a successful trade increases.
Real-World Example: Apple's 2019 Golden Cross
In early 2019, Apple (AAPL) formed a golden cross after falling nearly 40% from its October 2018 highs to its January 2019 lows around $142. The 50-day SMA crossed above the 200-day SMA in late March 2019, with the stock trading around $190.
The golden cross was accompanied by rising volume and an RSI above 50 but below 70, both confirming signals. Over the following 12 months, AAPL climbed to over $320, a gain of approximately 68% from the crossover point.
This example illustrates both the strength and limitation of the golden cross. The signal was highly profitable, but the stock had already risen roughly 34% from its lows before the cross formed. A trader who waited for the golden cross captured significant gains, but not from the absolute bottom.
FAQ
Is the golden cross a reliable buy signal?
The golden cross has a historical win rate of approximately 73% on major indices when measured over 12-month periods. It is one of the more reliable trend signals but should not be used in isolation. Combining it with volume analysis, RSI, and ADX improves its accuracy.
How often do golden crosses occur?
On major indices like the S&P 500, golden crosses occur roughly once every 2-4 years on average. On individual stocks, frequency varies based on the stock's volatility and trend behavior.
Should I buy immediately when a golden cross forms?
Not necessarily. Many traders achieve better risk-to-reward by waiting for a pullback to the 50-day SMA after the golden cross forms, rather than chasing the initial breakout. This approach also helps avoid false signals.
Can I use exponential moving averages for the golden cross?
Yes. Using EMAs for the golden cross produces earlier signals because EMAs weight recent prices more heavily. However, EMA golden crosses also generate more false signals than SMA versions. The tradeoff is speed versus reliability.
What timeframe works best for the golden cross?
The daily chart with 50-day and 200-day SMAs is the most widely followed and historically tested timeframe. Weekly charts produce fewer but more reliable signals. Intraday golden crosses are used by day traders but have much lower reliability.
Disclaimer
This is educational content, not financial advice. Trading involves risk, and you should consult a qualified financial advisor before making any investment decisions. Past performance does not guarantee future results.
12 chapters covering charts, indicators, risk management & more. Plus weekly trading insights.