RSI Indicator: Complete Guide to the Relative Strength Index
⚡ Key Takeaways
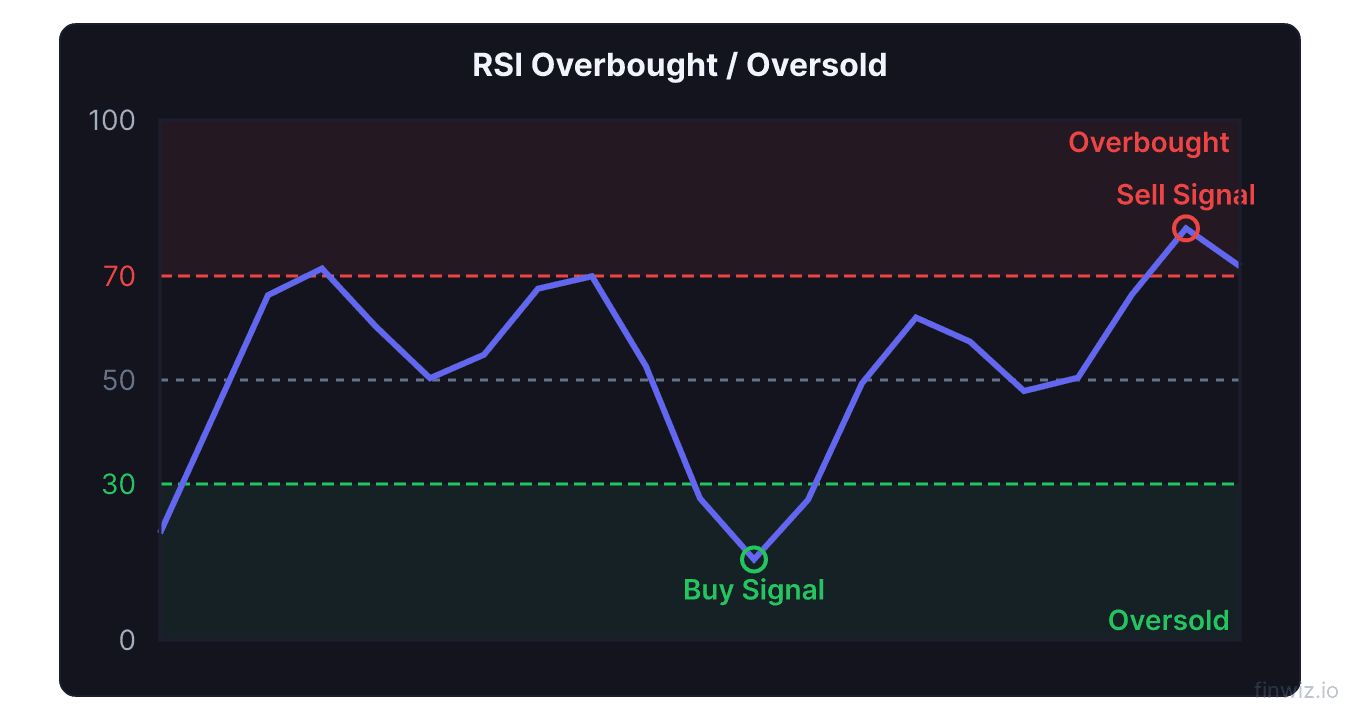
- RSI measures momentum on a 0-100 scale, with readings above 70 considered overbought and below 30 considered oversold
- The standard RSI period is 14, but shorter periods (like 9) increase sensitivity while longer periods (like 25) smooth out signals
- RSI divergence — when price and RSI move in opposite directions — is one of the most reliable reversal signals in technical analysis
- RSI works best when combined with other indicators like MACD, support/resistance levels, and volume confirmation
- Overbought does not automatically mean sell; in strong uptrends, RSI can remain overbought for extended periods
What Is the RSI Indicator?
The Relative Strength Index (RSI) is one of the most widely used momentum oscillators in technical analysis. Developed by J. Welles Wilder Jr. in 1978 and introduced in his book New Concepts in Technical Trading Systems, the RSI measures the speed and magnitude of recent price changes to evaluate whether a stock or asset is overbought or oversold.
RSI oscillates between 0 and 100 and is typically displayed as a line chart beneath the price chart. Traders use it to identify potential reversal points, confirm trends, and generate buy or sell signals. Its simplicity and versatility make it a go-to indicator for both beginners and experienced traders.
Unlike trend-following indicators such as moving averages, the RSI is a leading indicator that can signal potential reversals before they appear on the price chart. This characteristic makes it an essential tool in any trader's toolkit.
How the RSI Formula Works
Understanding the RSI formula helps you interpret the indicator with greater confidence. The calculation involves two main steps.
RS = Average Gain over N periods / Average Loss over N periodsThe RS (Relative Strength) value is calculated by dividing the average gain by the average loss over a specified lookback period. The standard lookback period is 14, meaning the indicator examines the last 14 price bars.
Here is how the averages are computed. First, the initial average gain is the sum of all gains over the first 14 periods divided by 14. The initial average loss uses the same approach. For subsequent periods, the calculation uses a smoothing method: the previous average gain is multiplied by 13, plus the current gain, then divided by 14. This smoothing technique gives more weight to recent data while still accounting for historical performance.
The RSI is then calculated as:
RSI = 100 - (100 / (1 + RS))This converts the RS ratio into a value between 0 and 100. When gains dominate, RS increases and RSI moves toward 100. When losses dominate, RS decreases and RSI moves toward 0.
Try It: RSI Calculator
Overbought and Oversold Levels
The most common application of RSI involves identifying overbought and oversold conditions. These are the default thresholds used by most traders.
| RSI Level | Condition | Typical Interpretation |
|---|---|---|
| Above 70 | Overbought | Price may be due for a pullback or reversal |
| 50 | Neutral midpoint | Indicates equilibrium between buyers and sellers |
| Below 30 | Oversold | Price may be due for a bounce or reversal |
When RSI crosses above 70, it suggests that the asset has been bought aggressively and may be overextended. Conversely, when RSI drops below 30, selling pressure may be exhausted and a bounce could be forthcoming.
However, one critical mistake beginners make is treating overbought and oversold signals as automatic buy or sell triggers. In strong trending markets, RSI can remain in overbought or oversold territory for extended periods. During a powerful bull run, RSI might hover between 60 and 80 for weeks without the price pulling back significantly.
Pro Tip
RSI Divergence: The Reversal Signal
RSI divergence occurs when the direction of the RSI indicator disagrees with the direction of the price action. This is widely considered one of the most powerful signals the RSI can produce.
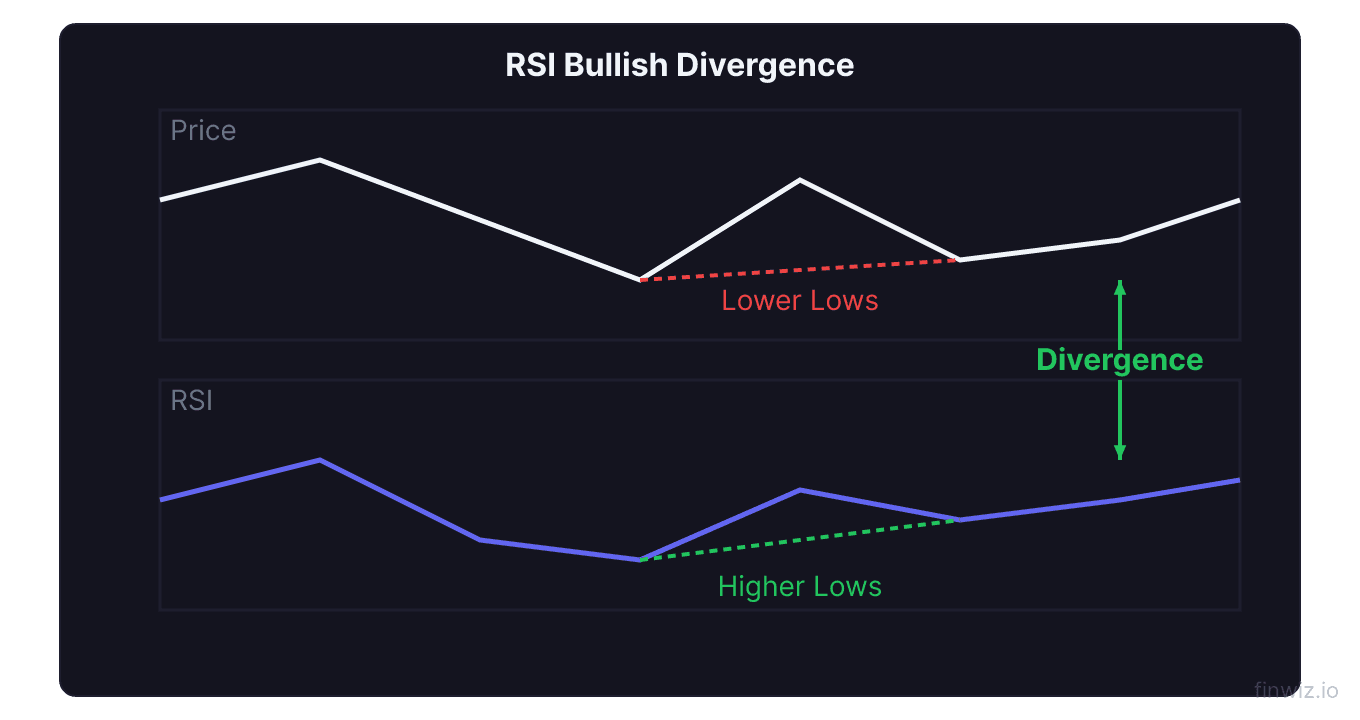
Bullish divergence forms when price makes a lower low, but RSI makes a higher low. This suggests that although price is declining, selling momentum is weakening. It often precedes an upward reversal and can be an excellent entry point when confirmed by other indicators like MACD or a break of support and resistance levels.
Bearish divergence forms when price makes a higher high, but RSI makes a lower high. This indicates that buying momentum is fading even as the price pushes higher. It frequently appears near market tops and can warn of an impending selloff.
Not all divergences lead to reversals. Sometimes a divergence can persist through multiple swings before price finally reverses. The best divergence signals occur at extreme RSI levels (near 70 or 30) and are confirmed by a break of a trendline or a key price level.
RSI Trading Strategies
There are several proven approaches to trading with RSI. Here are the strategies used most frequently by successful traders.
Strategy 1: Overbought/Oversold Reversals
The simplest strategy involves buying when RSI drops below 30 and then crosses back above it, and selling when RSI rises above 70 and then crosses back below. The key is to wait for the cross back through the threshold rather than acting the moment RSI reaches an extreme. This confirmation step significantly improves win rates.
Strategy 2: Centerline Crossovers
When RSI crosses above 50, it indicates that average gains are exceeding average losses, suggesting bullish momentum. When it crosses below 50, bearish momentum is dominant. Traders use the 50 level as a trend filter — only taking long trades when RSI is above 50 and short trades when below.
Strategy 3: RSI Trendlines
You can draw trendlines directly on the RSI chart, just as you would on a price chart. When RSI breaks a trendline, it often foreshadows a similar break in price. This technique can provide early entry signals before the price chart confirms the move.
Strategy 4: RSI with Moving Averages
Combining RSI with moving averages creates a robust system. Use a 200-period moving average to determine the overall trend direction. Then, only take RSI oversold signals as buy opportunities when price is above the 200 MA, and only take overbought signals as sell opportunities when price is below the 200 MA.
RSI Settings and Timeframes
The default RSI period of 14 works well for most applications, but adjusting the lookback period can optimize the indicator for different trading styles.
| Setting | Period | Best For | Sensitivity |
|---|---|---|---|
| Short-term | 7-9 | Day trading, scalping | High — more signals, more noise |
| Standard | 14 | Swing trading, general analysis | Balanced |
| Long-term | 21-25 | Position trading, investing | Low — fewer but more reliable signals |
Day traders often reduce the RSI period to 9 or even 7 to generate more frequent signals on intraday charts. This increased sensitivity comes at the cost of more false signals, so it should be paired with additional confirmation tools like VWAP or volume analysis.
Swing traders typically stick with the default 14-period setting on daily charts. This provides a good balance between signal frequency and reliability. The daily RSI is particularly effective for identifying multi-day to multi-week reversals.
Position traders and investors may extend the period to 21 or 25 on weekly charts. These longer settings filter out short-term noise and highlight only the most significant momentum shifts.
Pro Tip
RSI vs. Other Momentum Indicators
While RSI is the most popular momentum oscillator, understanding how it compares to alternatives helps you choose the right tool for each situation.
RSI vs. Stochastic Oscillator: The stochastic oscillator measures the closing price relative to the high-low range over a period, while RSI measures the magnitude of gains versus losses. Stochastic tends to be more sensitive and produces more signals, while RSI is smoother and better for identifying divergences.
RSI vs. MACD: The MACD is a trend-following momentum indicator, while RSI is a bounded oscillator. MACD excels at identifying trend direction and momentum changes, while RSI is better at identifying overbought and oversold conditions. Many traders use both together for a comprehensive momentum analysis.
RSI vs. Williams %R: Williams %R is essentially an inverted stochastic oscillator. Its scale runs from 0 to -100, making it a mirror image of many RSI signals. The main difference is that Williams %R uses only the close relative to the period high, while RSI uses average gains and losses.
Common RSI Mistakes to Avoid
Even experienced traders fall into traps when using RSI. Here are the most common pitfalls and how to avoid them.
Trading overbought/oversold blindly. As mentioned earlier, RSI can remain at extreme levels for extended periods in trending markets. Always confirm RSI signals with price action, trend analysis, or other indicators before placing a trade.
Ignoring the broader trend. RSI signals are most reliable when they align with the larger trend. An oversold reading in a strong downtrend is often just a pause before further decline, not a reversal signal. Always check the trend on a higher timeframe before acting on RSI signals.
Using RSI in isolation. No single indicator is sufficient for making trading decisions. Combine RSI with support and resistance levels, volume analysis, and at least one other indicator for a more complete picture.
Over-optimizing settings. Curve-fitting RSI settings to historical data may look great in backtests but often fails in live trading. Stick with standard settings (14 period, 70/30 levels) unless you have a well-tested reason to deviate.
Practical RSI Checklist for Traders
Before placing any trade based on RSI, run through this checklist to improve your decision-making process.
First, identify the overall trend using a moving average or higher timeframe analysis. Second, check whether RSI is at an extreme level (above 70 or below 30) and look for divergence with price. Third, wait for confirmation — a candlestick pattern, a break of a trendline, or a signal from another indicator. Fourth, define your stop-loss level, potentially using ATR for a volatility-adjusted stop. Fifth, set your profit target based on the nearest support or resistance level.
This disciplined approach transforms RSI from a simple indicator into a systematic edge that can improve your day trading strategies and swing trading setups alike.
Frequently Asked Questions
What is the best RSI setting for day trading?
Most day traders use RSI with a 9-period setting on 1-minute to 15-minute charts. The shorter period increases sensitivity, generating more frequent signals that suit the fast pace of intraday trading. However, this also produces more false signals. To compensate, day traders often combine short-period RSI with VWAP, volume confirmation, or price action patterns. Some day traders also use the 5-period RSI for scalping, though this extremely sensitive setting requires strict risk management.
Can RSI be used for crypto and forex trading?
Yes, RSI is one of the most versatile indicators across all markets. It works effectively on stocks, forex, cryptocurrency, commodities, and indices. For crypto markets, which tend to be more volatile, consider widening the overbought/oversold levels to 80/20 to reduce false signals. In forex, the standard 70/30 levels work well on the 4-hour and daily charts. The key principle — measuring momentum through relative gains and losses — applies universally regardless of the asset class.
How do you spot RSI divergence?
To identify RSI divergence, compare the swing highs and lows on the price chart with the corresponding swings on the RSI indicator. For bullish divergence, look for price making a lower low while RSI makes a higher low. For bearish divergence, look for price making a higher high while RSI makes a lower high. The clearest divergences occur when the RSI swings are at or near the 30 and 70 extremes. Always confirm divergence with a price action trigger such as a trendline break or candlestick reversal pattern before entering a trade.
Should I buy when RSI hits 30?
Not automatically. An RSI reading of 30 indicates that the asset is oversold, but oversold can stay oversold in strong downtrends. Instead of buying at 30, wait for RSI to cross back above 30, which indicates that selling pressure is subsiding. Even better, look for RSI divergence, a break of a downtrend line on the RSI, or confirmation from another indicator. The strongest buy signals occur when RSI is oversold, price is at a key support level, and volume shows accumulation.
What timeframe is best for RSI analysis?
The best timeframe depends on your trading style. For swing trading, the daily chart with a 14-period RSI is the gold standard and provides the most reliable signals. Day traders typically use 5-minute or 15-minute charts with a 9 or 14-period RSI. For investing and position trading, the weekly chart with a 14 or 21-period RSI identifies major turning points. Using RSI across multiple timeframes simultaneously — checking the weekly for the big picture and the daily for entries — produces the highest-quality signals.
Disclaimer
This is educational content, not financial advice. Trading involves risk, and you should consult a qualified financial advisor before making any investment decisions. Past performance does not guarantee future results.
Related Articles
12 chapters covering charts, indicators, risk management & more. Plus weekly trading insights.