Williams %R: Momentum Oscillator for Overbought/Oversold
⚡ Key Takeaways
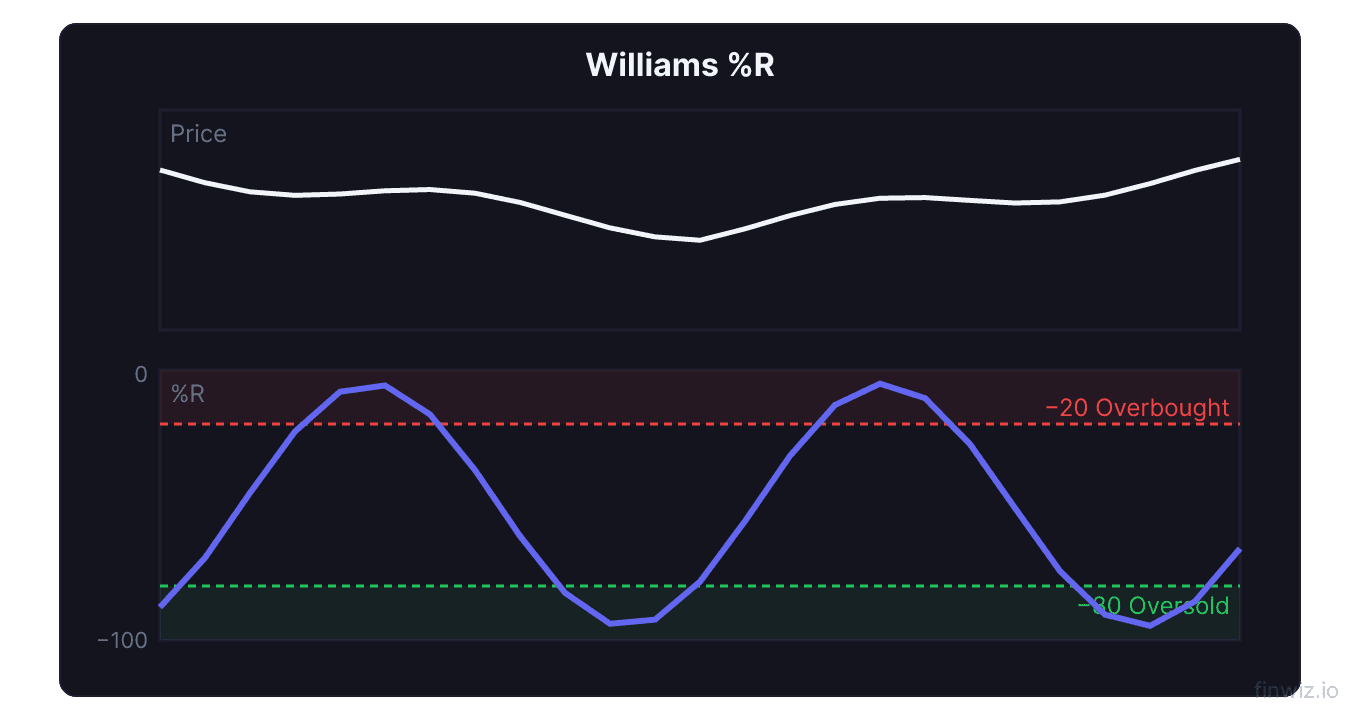
- Williams %R is a momentum oscillator ranging from 0 to -100 that measures the closing price relative to the highest high over a lookback period
- Readings above -20 indicate overbought conditions; readings below -80 indicate oversold conditions
- Williams %R is mathematically related to the stochastic oscillator but uses an inverted scale and slightly different calculation
- Failure swings — when %R reverses from an extreme without price confirming — are strong reversal signals
- The standard lookback period is 14, though shorter periods (like 10) increase sensitivity for active trading
What Is Williams %R?
Williams %R (Williams Percent Range) is a momentum oscillator developed by legendary trader Larry Williams in 1973. It measures the level of the closing price relative to the highest high over a specified lookback period, expressed on a scale from 0 to -100.
The indicator tells you where the current close sits within the recent trading range. A reading near 0 means the close is near the top of the range (overbought), while a reading near -100 means the close is near the bottom (oversold). This simple concept makes Williams %R one of the most intuitive momentum indicators available.
Williams %R is closely related to the stochastic oscillator — in fact, they are mathematically inverse. The key difference is that Williams %R uses a negative scale (0 to -100) and focuses on the relationship between the close and the period high, while the stochastic focuses on the close relative to the low. Despite these differences, both indicators capture similar momentum dynamics and frequently confirm each other.
Williams %R Formula
The Williams %R calculation is straightforward and elegant.
Williams %R = (Highest High - Close) / (Highest High - Lowest Low) x -100The formula measures how far the current close is from the top of the recent range, expressed as a negative percentage. When the close equals the highest high, %R = 0 (at the very top of the range). When the close equals the lowest low, %R = -100 (at the very bottom).
| %R Reading | Position in Range | Interpretation |
|---|---|---|
| 0 | Close equals period high | Maximum bullish momentum |
| -20 | Close near the top of range | Overbought territory |
| -50 | Close at midpoint | Neutral — no directional bias |
| -80 | Close near the bottom of range | Oversold territory |
| -100 | Close equals period low | Maximum bearish momentum |
The negative scale can be initially confusing. Just remember: closer to 0 = stronger (near the high) and closer to -100 = weaker (near the low). Some charting platforms display Williams %R with an inverted axis so that it visually resembles other oscillators with overbought at the top and oversold at the bottom.
Pro Tip
Overbought and Oversold Signals
Williams %R uses -20 and -80 as its standard overbought and oversold thresholds.
Overbought (above -20): When %R crosses above -20, the closing price is in the upper 20% of the recent range. This suggests that buying momentum may be overextended. However, in strong uptrends, %R can remain above -20 for extended periods — sustained overbought readings actually confirm trend strength.
Oversold (below -80): When %R drops below -80, the closing price is in the lower 20% of the range. Selling pressure may be exhausted, and a bounce could be imminent. As with overbought conditions, oversold can persist in strong downtrends.
The most reliable approach is to wait for %R to exit the extreme zone rather than enter when it first reaches the extreme. For a buy signal, wait for %R to drop below -80 and then cross back above -80. For a sell signal, wait for %R to rise above -20 and then cross back below -20.
This confirmation technique aligns with the same principle used in RSI and stochastic oscillator trading — the reversal from an extreme is a stronger signal than the extreme itself.
Williams %R Failure Swings
Failure swings are among the most powerful signals Williams %R produces. A failure swing occurs when %R reaches an extreme, reverses, approaches the extreme again, but fails to reach it on the second attempt.
Bullish failure swing: %R drops below -80 (oversold), bounces above -80, pulls back but stays above -80 on the second dip, and then moves higher. The failure to return to oversold territory on the second attempt shows that selling momentum is diminishing. This is a buy signal.
Bearish failure swing: %R rises above -20 (overbought), drops below -20, rallies but fails to reach -20 on the second push, and then declines further. The failure to return to overbought territory on the second attempt indicates fading buying pressure. This is a sell signal.
Failure swings are conceptually similar to double top and double bottom patterns on the price chart, but they appear on the momentum indicator. They are particularly reliable when they coincide with price patterns — a %R bearish failure swing that coincides with a double top price pattern, for example, is an exceptionally strong sell signal.
Pro Tip
Williams %R Divergence
Like other oscillators, Williams %R produces divergence signals when it moves opposite to price direction.
Bullish divergence: Price makes a lower low, but %R makes a higher low (a less negative reading). This indicates that despite the price decline, downward momentum is decreasing. Sellers are losing conviction, and a reversal may be approaching.
Bearish divergence: Price makes a higher high, but %R makes a lower high (a more negative reading). Upward momentum is weakening even as price advances. Buyers are losing enthusiasm, which often precedes a pullback or reversal.
Williams %R divergence is particularly useful because the indicator is sensitive to price changes within the range. Even subtle shifts in momentum that RSI might miss can appear as divergence on Williams %R due to its direct relationship with the high-low range.
For maximum reliability, confirm %R divergence with at least one other momentum indicator. When RSI, MACD, and Williams %R all show divergence simultaneously, the reversal signal is exceptionally strong.
Williams %R vs. Stochastic Oscillator
Williams %R and the stochastic oscillator are mathematically related, which leads to frequent questions about which is better.
| Feature | Williams %R | Stochastic %K |
|---|---|---|
| Scale | 0 to -100 | 0 to 100 |
| Measures | Close relative to high | Close relative to low |
| Signal line | None (single line) | %D line provides crossovers |
| Smoothing | None (raw) | Available (fast vs. slow) |
| Overbought/Oversold | -20 / -80 | 80 / 20 |
| Sensitivity | High | Depends on smoothing |
The relationship is straightforward: Williams %R = Stochastic %K - 100 (when calculated over the same period). They are essentially mirror images of each other on different scales.
The practical differences emerge in application. Williams %R is a single unsmoothed line, making it faster but noisier. The stochastic oscillator offers a signal line (%D) that provides crossover signals Williams %R lacks. The stochastic also offers fast and slow versions with varying levels of smoothing.
When to use Williams %R: Choose Williams %R when you want the fastest possible momentum reading without smoothing delay. It excels at identifying extreme conditions and failure swings. It is simpler and requires less parameter tuning than the stochastic.
When to use the stochastic: Choose the stochastic when you want crossover signals between %K and %D, or when you prefer a smoother indicator that produces fewer false signals. The slow stochastic is better for swing trading.
Williams %R Trading Strategies
Strategy 1: Oversold Bounce with Trend Filter
Combine Williams %R with a 200-day moving average trend filter. When price is above the 200 MA (uptrend), buy when %R drops below -80 and crosses back above it. When price is below the 200 MA (downtrend), sell when %R rises above -20 and crosses back below. This alignment with the larger trend significantly improves win rates.
Strategy 2: Failure Swing Reversal
Monitor Williams %R for failure swings in overbought and oversold territory. Enter on the second swing's failure — long when %R fails to reach -80 on the second oversold attempt, short when %R fails to reach -20 on the second overbought attempt. Confirm with volume and support/resistance analysis. Place your stop beyond the recent price extreme.
Strategy 3: Multiple Timeframe Williams %R
Check the weekly Williams %R for the broad momentum direction and the daily %R for entry timing. Enter daily oversold buy signals only when weekly %R is above -50 (indicating overall bullish momentum). Enter daily overbought sell signals only when weekly %R is below -50. This multi-timeframe filter aligns short-term entries with the larger momentum cycle.
Strategy 4: Williams %R with Bollinger Bands
Combine Williams %R with Bollinger Bands for a double-confirmation mean-reversion system. When price touches the lower Bollinger Band and %R is below -80, both indicators confirm an oversold condition. Enter long when %R crosses back above -80. Target the middle Bollinger Band or VWAP. This dual confirmation reduces false oversold signals significantly.
Strategy 5: Williams %R Divergence with RSI
Use both Williams %R and RSI for divergence analysis. When both indicators show bullish divergence from price (higher lows on the oscillators, lower lows on price), the reversal signal is reinforced. Enter on a price action trigger such as a bullish candlestick pattern or a break of a short-term trendline.
Williams %R Settings
The standard Williams %R lookback period is 14, but adjustments can be made for different trading objectives.
| Setting | Lookback Period | Sensitivity | Best For |
|---|---|---|---|
| Aggressive | 7-9 | Very high — frequent extremes | Day trading, scalping |
| Standard | 14 | Balanced | Swing trading, general use |
| Conservative | 21-28 | Lower — fewer extremes | Position trading, weekly charts |
Shorter periods (7-9) make Williams %R extremely sensitive. The indicator will reach -20 and -80 more frequently, generating more signals but also more noise. This setting is useful for day traders who want fast momentum readings on intraday charts like the 5-minute or 15-minute.
The standard 14-period provides a balance between sensitivity and reliability. On daily charts, it captures approximately two weeks of price action, which is meaningful for swing trading decisions.
Longer periods (21-28) smooth the indicator and reduce the frequency of extreme readings. When %R does reach an extreme with these settings, the signal is more significant because it takes a sustained move to push the indicator to -20 or -80.
Practical Application Tips
Combine with volume analysis. Williams %R, like all momentum oscillators, does not account for volume. An oversold %R reading is more meaningful when accompanied by declining volume (selling exhaustion) or a volume climax spike (capitulation). Check OBV trends and raw volume patterns to validate %R signals.
Watch for sustained extremes. When %R stays above -20 for an extended period, it indicates a strong uptrend rather than an overbought condition to fade. Similarly, sustained readings below -80 indicate a strong downtrend. Fade extremes in ranges; respect them in trends.
Use %R for exit timing. Williams %R can help time exits as well as entries. If you are in a long position and %R reaches -20, consider tightening your stop or taking partial profits. The overbought reading does not guarantee a reversal, but it indicates that the easy part of the rally may be over.
Layer with Fibonacci levels. When a Fibonacci retracement level coincides with an oversold Williams %R reading, the buy signal has both price structure and momentum confirmation. This confluence significantly increases the probability of a successful entry.
Common Williams %R Mistakes
Treating extremes as automatic signals. An overbought or oversold reading alone is not a trade signal. Wait for the indicator to leave the extreme zone, spot a failure swing, or identify divergence before acting. Raw extreme readings are context, not signals.
Ignoring the trend. Fading overbought readings in a strong uptrend or buying oversold readings in a strong downtrend leads to consistent losses. Always determine the trend direction first using moving averages or ADX, and only take %R signals that align with the prevailing trend.
Using Williams %R in isolation. As a single unsmoothed line, Williams %R generates frequent signals that include significant noise. Always confirm with at least one additional tool — volume, a second momentum indicator, or price action patterns.
Confusing the scale. The negative scale (0 to -100) is the opposite of what most traders expect. Overbought is near 0, not near 100. Double-check your interpretation when you first start using this indicator to avoid costly misreadings.
Frequently Asked Questions
Is Williams %R the same as the stochastic oscillator?
Williams %R and the stochastic oscillator are mathematically related but not identical. Williams %R measures the close relative to the period high on a 0 to -100 scale, while the stochastic measures the close relative to the period low on a 0 to 100 scale. Williams %R equals the stochastic %K minus 100. The practical difference is that stochastic offers smoothing options (fast vs. slow) and a signal line (%D) for crossovers, while Williams %R is a single unsmoothed line. Many traders choose one or the other since they provide similar information.
What is the best Williams %R setting?
The standard 14-period setting works well for most applications on daily charts. For day trading on 5-minute or 15-minute charts, a shorter period of 9 or 10 increases sensitivity for faster signals. For weekly chart analysis, consider extending to 21 periods. The key is matching the lookback period to your trading timeframe — shorter periods for shorter timeframes and longer periods for longer timeframes. Always backtest any setting changes on your specific market before trading with real capital.
How do you trade Williams %R divergence?
To trade Williams %R divergence, first identify a divergence between price and the indicator. For a bullish divergence trade, wait for price to make a lower low while %R makes a higher low (less negative). Then wait for a trigger — %R crossing back above -80, a bullish candlestick pattern, or a break of a short-term downtrend line. Enter long with a stop below the recent low. Target the nearest resistance level or use a 2:1 reward-to-risk ratio. For bearish divergence, the process is reversed.
Can Williams %R be used for cryptocurrency?
Yes, Williams %R works on cryptocurrency markets with the same principles as traditional markets. On major crypto pairs with high liquidity (BTC, ETH), the indicator provides reliable momentum readings. Due to crypto's higher volatility, you may want to use the standard 14-period or even extend to 21 on daily charts to reduce noise. On intraday crypto charts, shorter periods work but should be combined with volume analysis and support/resistance levels for confirmation.
Why does Williams %R use a negative scale?
Larry Williams designed the indicator with a negative scale (0 to -100) to emphasize a specific perspective — measuring how far the close has fallen from the highest high. A reading of 0 means the close is at the peak (no decline from the high), while -100 means it has fallen to the bottom of the range. This "distance from the top" perspective provides a different analytical lens than the stochastic's "distance from the bottom" approach. While the negative scale can be initially confusing, it becomes natural with practice, and many platforms offer the option to invert the display axis for visual clarity.
Disclaimer
This is educational content, not financial advice. Trading involves risk, and you should consult a qualified financial advisor before making any investment decisions. Past performance does not guarantee future results.
Related Articles
12 chapters covering charts, indicators, risk management & more. Plus weekly trading insights.