Fibonacci Retracement: Levels, Drawing & Trading Strategy
⚡ Key Takeaways
- Fibonacci retracement levels (23.6%, 38.2%, 50%, 61.8%, 78.6%) identify potential support and resistance zones during pullbacks within a trend
- The 61.8% level (the Golden Ratio) is the most significant retracement level and frequently acts as strong support or resistance
- Fibonacci extensions (127.2%, 161.8%, 261.8%) project potential profit targets beyond the original price swing
- Fibonacci levels work best when they align with other technical factors like moving averages, VWAP, or horizontal support/resistance
- Draw Fibonacci retracements from the swing low to the swing high in uptrends and from the swing high to the swing low in downtrends
What Is Fibonacci Retracement?
Fibonacci retracement is a technical analysis tool that uses horizontal lines to identify potential support and resistance levels where a price pullback might pause or reverse. These levels are derived from the Fibonacci sequence, a mathematical pattern found throughout nature, art, and financial markets.
The core idea is that after a significant price move, the price tends to retrace a portion of that move before continuing in the original direction. Fibonacci retracement levels predict where these pullbacks are most likely to find support or resistance. While the tool does not guarantee price will stop at any particular level, decades of market observation have shown that prices frequently react at these mathematically derived zones.
Fibonacci retracements are used by traders across all markets and timeframes. Whether you trade stocks, forex, futures, or cryptocurrency, these levels provide a framework for identifying high-probability entry and exit points during pullbacks within a larger trend.
The Fibonacci Sequence and Key Ratios
The Fibonacci sequence begins with 0 and 1, with each subsequent number being the sum of the two preceding numbers: 0, 1, 1, 2, 3, 5, 8, 13, 21, 34, 55, 89, 144, and so on.
The key ratios used in trading are derived from the mathematical relationships between these numbers.
| Ratio | How It Is Derived | Significance |
|---|---|---|
| 23.6% | Divide a number by the number three places higher | Shallow retracement — strong trending moves |
| 38.2% | Divide a number by the number two places higher | Moderate retracement — common in healthy trends |
| 50.0% | Not a Fibonacci ratio, but widely used | Psychological midpoint of any move |
| 61.8% | Divide a number by the next higher number (Golden Ratio) | Most important level — last stand for trends |
| 78.6% | Square root of 61.8% | Deep retracement — trend may be reversing |
The 61.8% level is the most famous and is known as the Golden Ratio (or Phi). This ratio appears throughout nature — in the spiral of shells, the branching of trees, and the proportions of the human body. Its prominence in financial markets is debated, but its practical utility as a trading tool is well-established.
Pro Tip
How to Draw Fibonacci Retracements
Drawing Fibonacci retracements correctly is essential for getting accurate levels. The process is straightforward, but the starting and ending points matter.
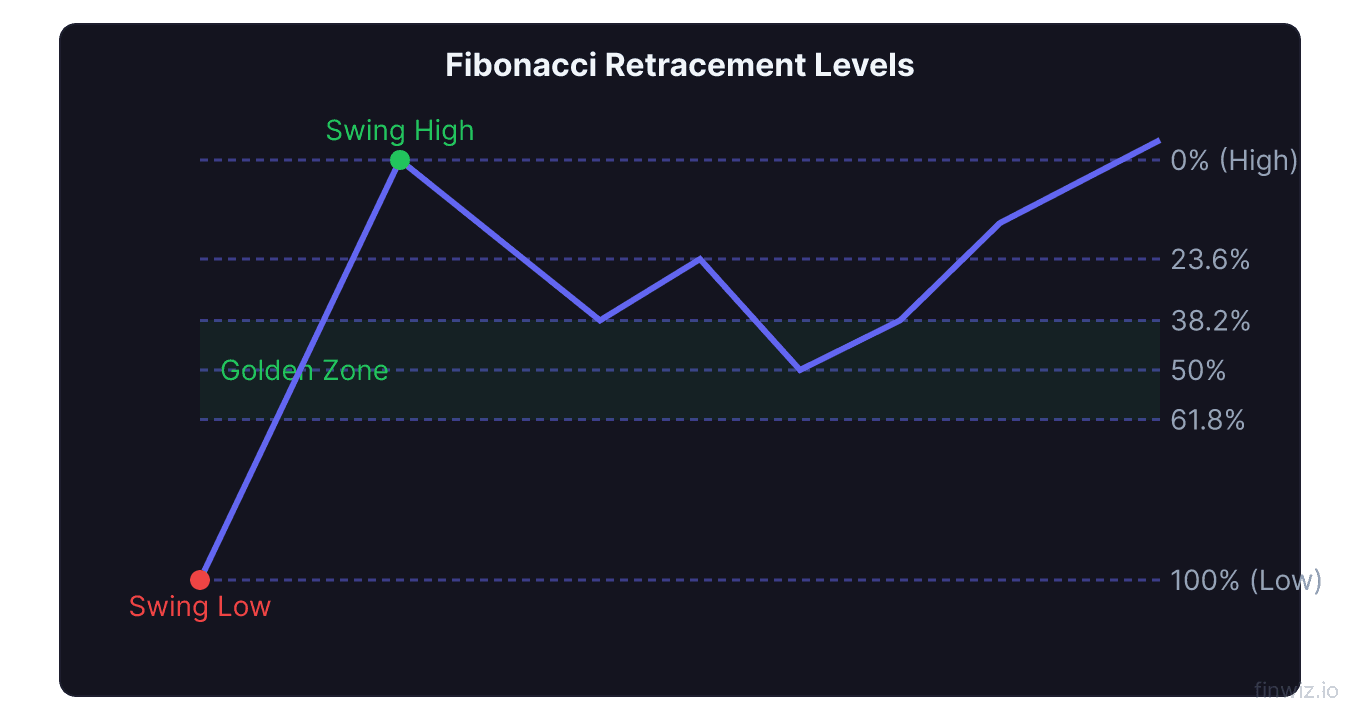
In an uptrend, draw the Fibonacci retracement from the swing low to the swing high. The tool will automatically plot the retracement levels between these two points. The 0% level appears at the swing high, and the 100% level appears at the swing low. When price pulls back, it will approach the retracement levels from top to bottom.
In a downtrend, draw from the swing high to the swing low. The 0% level appears at the swing low, and the 100% level appears at the swing high. When price bounces, it will approach the retracement levels from bottom to top.
Selecting the correct swing points is the most subjective part of using Fibonacci retracements. Use clear, significant swing highs and lows that are visible on your chart. Avoid using minor intraday swings unless you are specifically trading on an intraday timeframe. The more significant the swing points, the more reliable the resulting Fibonacci levels.
Multiple Fibonacci drawings can be applied simultaneously from different swing points. When retracement levels from different swings align at the same price level, this creates a Fibonacci cluster — a zone of particularly strong support or resistance.
Trading with Fibonacci Retracement Levels
Each retracement level tells a different story about the strength of the pullback and the underlying trend.
The 23.6% Retracement
A pullback that reverses at the 23.6% level indicates a very strong trend. Buyers are so eager that they step in at the shallowest possible pullback. This level is most relevant in aggressive, momentum-driven moves. If you miss an entry at 23.6%, the next opportunity may not come until a deeper correction occurs much later.
The 38.2% Retracement
The 38.2% retracement is considered a moderate pullback and is common in healthy trends. It offers a better entry price than 23.6% without suggesting weakness in the trend. Many swing trading strategies target entries at this level.
The 50% Retracement
While not a true Fibonacci ratio, the 50% level is psychologically significant. It represents the midpoint of the move and is widely monitored. In many textbook trends, price pulls back to 50%, holds, and then resumes the trend direction.
The 61.8% Retracement
The 61.8% Golden Ratio is the most critical Fibonacci level. If a pullback reaches 61.8% and holds, the trend is likely to resume. If price breaks convincingly through 61.8%, the trend may be in trouble. Many traders place their entries at 61.8% with tight stops, understanding that a failure here could indicate a trend reversal.
The 78.6% Retracement
A pullback to 78.6% represents a deep retracement that questions whether the trend is still intact. While some pullbacks do reverse at this level, a retracement this deep often indicates that the original trend has weakened significantly. Traders who enter at 78.6% are taking on more risk and should use tighter stops.
Fibonacci Extensions for Profit Targets
Fibonacci extensions project price levels beyond the original swing, providing potential profit targets for trades entered during pullbacks.
Extension Level = Swing Low + (Swing High - Swing Low) x Extension Ratio| Extension Level | Usage | Probability of Reaching |
|---|---|---|
| 127.2% | Conservative first target | High |
| 161.8% | Standard target | Moderate |
| 200.0% | Extended target | Lower |
| 261.8% | Aggressive target for strong trends | Lowest |
The 161.8% extension is the most commonly used profit target. It is derived directly from the Golden Ratio and represents a proportional extension of the original price swing. In practice, when price bounces from a Fibonacci retracement level and begins a new leg higher, the 161.8% extension of the pullback frequently acts as resistance.
Pro Tip
Fibonacci Confluence Zones
The real power of Fibonacci analysis emerges when retracement levels from different swings, timeframes, or tools converge at the same price level. These confluence zones are where the highest probability trades set up.
Fibonacci + Moving Averages: When a 61.8% retracement lands exactly on the 50-day moving average, both tools point to the same support level. This double confirmation makes the level far more significant than either would be alone.
Fibonacci + VWAP: On intraday charts, when a Fibonacci retracement coincides with VWAP, the level attracts both Fibonacci traders and institutional volume-weighted algorithms, creating robust support or resistance.
Fibonacci + Horizontal Support: When a retracement level aligns with a previous price high, low, or consolidation zone, the confluence provides a powerful zone for entries. Historical price memory combined with mathematical proportionality creates exceptionally strong levels.
Multiple Timeframe Fibonacci: Drawing retracements on both the daily and weekly charts can reveal levels that are significant on both timeframes. A 38.2% weekly retracement that coincides with a 61.8% daily retracement creates a multi-timeframe confluence that institutions monitor.
Fibonacci in Practice: Step-by-Step
Here is a practical workflow for using Fibonacci retracements in your trading.
Step 1: Identify the trend. Before drawing any Fibonacci levels, determine the prevailing trend direction using moving averages or ADX. You only want to trade pullbacks within established trends.
Step 2: Identify the significant swing. Find the most recent significant swing high and swing low. These should be clear turning points visible on your chosen timeframe.
Step 3: Draw the retracement. Use your charting platform's Fibonacci retracement tool to draw from the swing low to swing high (in uptrends) or swing high to swing low (in downtrends).
Step 4: Watch for price reaction. As price pulls back, observe how it interacts with each level. Look for candlestick patterns, volume surges, or momentum indicator signals at key Fibonacci levels. An RSI divergence at a 61.8% retracement, for example, is a powerful combination.
Step 5: Enter with confirmation. Do not enter blindly at a Fibonacci level. Wait for a confirmation signal — a reversal candlestick, a break of a micro trendline, an MACD crossover, or a volume surge — before committing capital.
Step 6: Set stops and targets. Place your stop just beyond the next Fibonacci level (for example, below 78.6% if you entered at 61.8%). Use Fibonacci extensions for profit targets.
Common Fibonacci Mistakes
Cherry-picking swing points. The most common error is selecting swing points that produce levels matching your existing bias. Choose the most obvious, significant swings on the chart — the ones any trader would identify. If you find yourself adjusting the starting points to make levels line up with your desired entry, you are curve-fitting.
Trading Fibonacci levels in isolation. Fibonacci levels are potential zones of interest, not guaranteed reversal points. Without confirmation from price action, volume, or other indicators, blindly buying at a 61.8% retracement will produce many losses.
Ignoring the trend. Fibonacci retracements are designed for trading pullbacks within trends. Using them in choppy, trendless markets significantly reduces their effectiveness. Confirm the trend before applying the tool.
Using too many levels. Some traders add every possible Fibonacci level and find that price always seems to be near one. This defeats the purpose. Focus on the big three: 38.2%, 50%, and 61.8%.
Neglecting other confluence factors. Fibonacci levels gain their true power from confluence with other technical tools. A Fibonacci level standing alone is significantly weaker than one confirmed by a moving average, horizontal support, volume profile, or Bollinger Band level.
Fibonacci on Different Timeframes
Fibonacci retracements work on all timeframes, but higher timeframes produce more reliable levels.
Weekly and monthly charts produce Fibonacci levels that institutions and fund managers watch. A 61.8% retracement on a monthly chart can hold for months, providing a base for a significant rally. These are the levels that move markets.
Daily charts are the most commonly used timeframe for Fibonacci analysis. Levels drawn on daily swings are relevant for swing traders and position traders. Most trading education and Fibonacci studies reference daily chart applications.
Intraday charts (15-minute to 1-hour) produce Fibonacci levels useful for day trading. These levels are shorter-lived but can provide precise entry and exit points during the trading day. Combine intraday Fibonacci with VWAP for the best results.
The best approach is to draw Fibonacci retracements on multiple timeframes and identify where levels from different timeframes converge. A 50% retracement on the daily chart that coincides with a 38.2% retracement on the weekly chart creates a high-confidence zone.
Frequently Asked Questions
Why do Fibonacci levels work in trading?
The effectiveness of Fibonacci levels in trading is partly self-fulfilling and partly rooted in market psychology. Because millions of traders use Fibonacci retracements, orders cluster at these levels, creating actual supply and demand zones. Additionally, the Fibonacci ratios describe natural proportions that appear throughout nature and human behavior. Whether the math itself is predictive or the collective belief of traders makes it predictive is debated, but the practical outcome is the same — price frequently reacts at these levels.
What is the most important Fibonacci level?
The 61.8% retracement level (the Golden Ratio) is generally considered the most important. It represents the dividing line between a healthy pullback and a potential trend reversal. In many trending markets, the 50-61.8% zone is where the majority of successful pullback entries occur. If price holds at 61.8%, the trend is likely intact. If it fails, traders should consider that the trend may be reversing. The 38.2% level is the second most important, particularly in strong trends.
How accurate are Fibonacci retracements?
Fibonacci retracements are not precise to the penny — they identify zones rather than exact prices. Studies have shown that price tends to react near Fibonacci levels more often than at random price points, but the reaction may occur slightly above or below the exact level. Accuracy improves significantly when Fibonacci levels are combined with other technical tools. A standalone Fibonacci level might see a reaction 40-50% of the time, but a Fibonacci level with moving average confluence might see reactions 60-70% of the time.
Can I use Fibonacci on any market?
Yes, Fibonacci retracements are universally applicable across all financial markets including stocks, forex, futures, commodities, and cryptocurrency. They work because the underlying principle — that pullbacks tend to retrace a proportional distance of the prior move — applies to any market where crowd psychology drives price. Some traders find Fibonacci particularly effective in forex markets due to the technical nature of currency trading and the high participation of algorithmic traders that reference these levels.
How do Fibonacci retracements differ from extensions?
Fibonacci retracements measure pullbacks within an existing move and identify potential support or resistance levels between the swing high and swing low. Extensions project beyond the original swing to identify potential profit targets. Retracements help you find entries during pullbacks, while extensions help you set exits for profitable trades. Both use the same mathematical ratios but apply them in different ways. Most traders use retracements for entry planning and extensions for profit target planning as complementary tools within the same analysis framework.
Disclaimer
This is educational content, not financial advice. Trading involves risk, and you should consult a qualified financial advisor before making any investment decisions. Past performance does not guarantee future results.
Related Articles
12 chapters covering charts, indicators, risk management & more. Plus weekly trading insights.