MACD Indicator: How to Read & Trade Moving Average Convergence Divergence
⚡ Key Takeaways
- MACD consists of three components: the MACD line, the signal line, and the histogram, each providing different types of trading signals
- A bullish signal occurs when the MACD line crosses above the signal line; a bearish signal occurs when it crosses below
- MACD divergence from price is one of the strongest reversal warnings in technical analysis
- The standard MACD settings (12, 26, 9) work well for most timeframes, but can be adjusted for faster or slower signals
- MACD is a lagging indicator — it confirms trends rather than predicting them, making it best used with leading indicators like RSI
What Is the MACD Indicator?
The Moving Average Convergence Divergence (MACD) is a trend-following momentum indicator that reveals the relationship between two exponential moving averages of a security's price. Developed by Gerald Appel in the late 1970s, MACD has become one of the most trusted and widely used indicators in technical analysis.
MACD serves a dual purpose. It functions both as a trend indicator and a momentum oscillator. This versatility makes it useful across different market conditions and timeframes. Whether you are day trading or managing a longer-term portfolio, MACD provides actionable signals about the direction and strength of price trends.
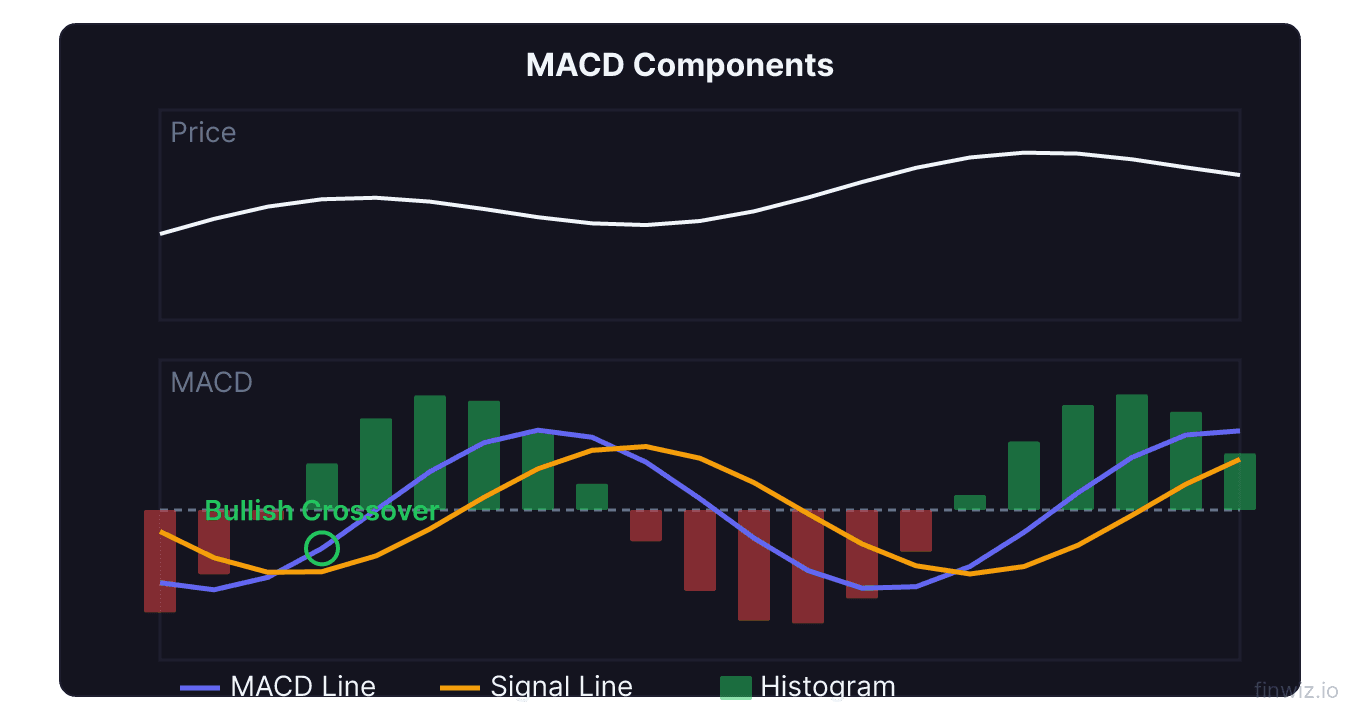
The indicator appears below the price chart and consists of two lines and a histogram. Understanding each component is essential before you begin using MACD in live trading.
MACD Components Explained
The MACD indicator has three distinct components, and each provides a different piece of information about price momentum.
The MACD Line is the primary line and is calculated by subtracting the 26-period exponential moving average (EMA) from the 12-period EMA.
MACD Line = 12-period EMA − 26-period EMAWhen the short-term EMA is above the long-term EMA, the MACD line is positive, indicating bullish momentum. When the short-term EMA is below the long-term EMA, the MACD line is negative, indicating bearish momentum.
The Signal Line is a 9-period EMA of the MACD line itself. It acts as a trigger for buy and sell signals. Because it smooths the MACD line, it responds more slowly to price changes and serves as a reference point for crossover signals.
The MACD Histogram represents the difference between the MACD line and the signal line. When the histogram is positive, the MACD line is above the signal line (bullish). When negative, the MACD line is below (bearish). The histogram visually shows the momentum behind the crossover — growing bars indicate strengthening momentum, while shrinking bars suggest momentum is fading.
| Component | Calculation | What It Shows |
|---|---|---|
| MACD Line | 12 EMA minus 26 EMA | Direction and magnitude of momentum |
| Signal Line | 9 EMA of MACD Line | Smoothed momentum for crossover signals |
| Histogram | MACD Line minus Signal Line | Rate of change of momentum |
How to Read MACD Signals
There are four primary signal types generated by MACD. Each tells a different story about the market's momentum and trend direction.
Signal Line Crossovers
The most common MACD signal is the signal line crossover. A bullish crossover occurs when the MACD line crosses above the signal line, suggesting upward momentum is building. A bearish crossover occurs when the MACD line crosses below the signal line, indicating downward momentum.
The strength of a crossover signal depends on its location relative to the zero line. Bullish crossovers that occur well below zero tend to be stronger because they indicate a shift from deeply bearish to emerging bullish momentum. Similarly, bearish crossovers above zero can mark the start of significant declines.
Pro Tip
Zero Line Crossovers
When the MACD line crosses above the zero line, it means the 12-period EMA has crossed above the 26-period EMA — essentially a bullish moving average crossover. When it crosses below zero, the opposite is true.
Zero line crossovers are trend-confirming signals. They tend to lag behind signal line crossovers but are more reliable for identifying the beginning of new trends. Many traders use zero line crossovers as a trend filter, only taking long trades when MACD is above zero and short trades when below.
MACD Divergence
MACD divergence occurs when the MACD indicator moves in the opposite direction of the price, signaling that the current trend may be losing strength. Divergence is one of the most powerful signals MACD can produce.
Bullish divergence forms when price makes a lower low, but the MACD makes a higher low. This suggests that although price is declining, the rate of decline is slowing. It frequently appears near the end of downtrends and can signal a reversal to the upside.
Bearish divergence forms when price makes a higher high, but the MACD makes a lower high. Buying momentum is fading even as price pushes higher. This often precedes a pullback or trend reversal.
There is also hidden divergence, which confirms trend continuation rather than reversal. Hidden bullish divergence occurs when price makes a higher low but MACD makes a lower low — the trend is intact and likely to continue upward. Hidden bearish divergence occurs when price makes a lower high but MACD makes a higher high.
Divergence works best when confirmed by other technical factors such as support and resistance levels, trendline breaks, or signals from the RSI. Acting on divergence alone can lead to premature entries, as divergence can persist for several bars before price finally reverses.
MACD Histogram Strategies
The histogram deserves special attention because it often provides the earliest warnings of momentum shifts. Since the histogram measures the distance between the MACD line and signal line, changes in the histogram often precede the actual crossover.
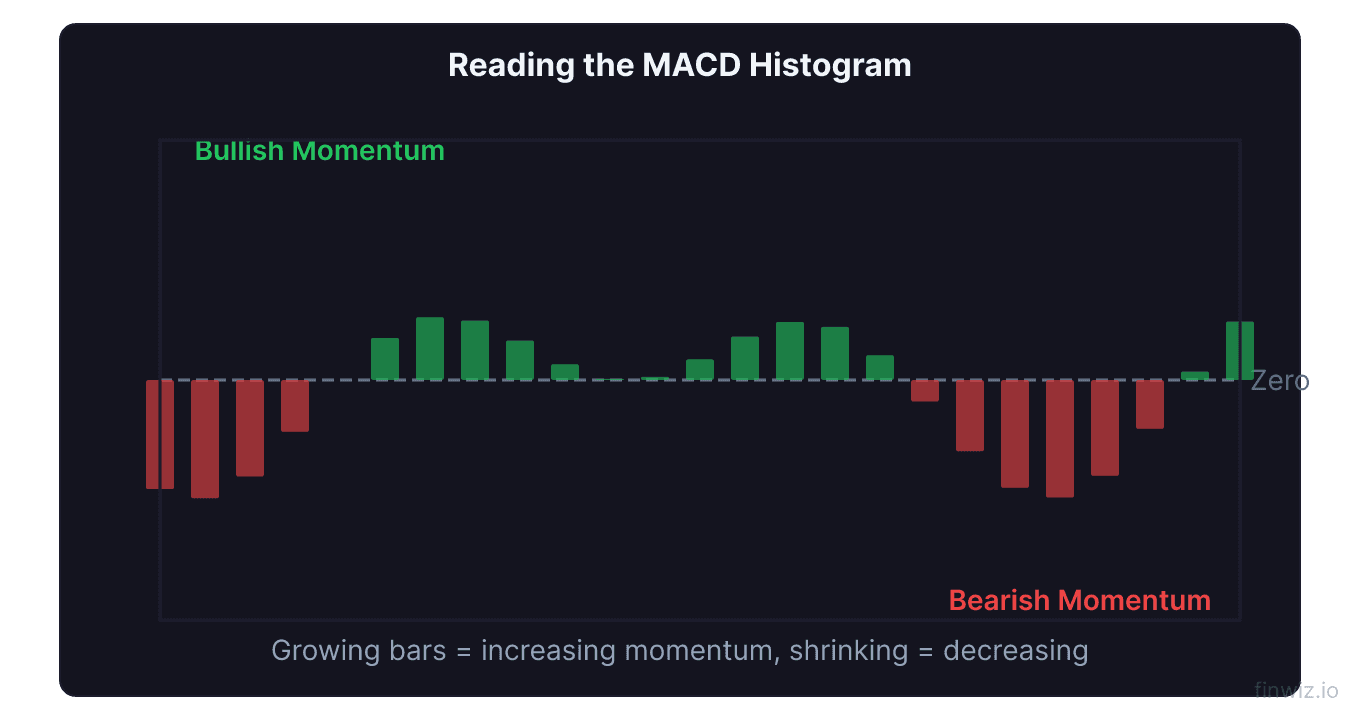
Histogram reversal is a signal that occurs when the histogram changes direction without a full crossover. For example, if the histogram has been declining (becoming more negative) and then prints a shorter bar, it indicates that bearish momentum is slowing. This can serve as an early warning that a bullish crossover may be approaching.
The histogram can also be used for momentum divergence. When the histogram makes a lower peak on a second rally while price makes a higher high, it shows fading momentum. This histogram divergence is often more sensitive than divergence measured on the MACD line itself.
Pro Tip
Best MACD Settings
The standard MACD settings of 12, 26, and 9 have stood the test of time and work well across most markets and timeframes. However, different trading styles may benefit from adjustments.
| Trading Style | Fast EMA | Slow EMA | Signal | Use Case |
|---|---|---|---|---|
| Standard | 12 | 26 | 9 | All-purpose, swing trading |
| Fast | 8 | 17 | 9 | Day trading, quick signals |
| Slow | 19 | 39 | 9 | Position trading, fewer false signals |
| Weekly | 12 | 26 | 9 | Weekly chart analysis |
Day traders often prefer faster settings like (8, 17, 9) to generate more responsive signals on intraday charts. These settings produce more crossovers, which suits the fast pace of day trading strategies. The trade-off is an increase in false signals.
Swing traders typically stay with the standard (12, 26, 9) settings on daily charts. This configuration provides a good balance between responsiveness and signal quality for trades lasting several days to weeks.
Position traders may opt for slower settings like (19, 39, 9) to filter out noise and focus on major trend changes. Some use the standard settings on weekly charts instead, which naturally smooths the data without changing the parameters.
Combining MACD with Other Indicators
MACD is most effective when used as part of a broader trading system. Here are the best complementary indicators.
MACD + RSI: This is one of the most popular indicator combinations in trading. The RSI identifies overbought and oversold conditions, while MACD confirms trend direction and momentum. When RSI reaches oversold territory and MACD produces a bullish crossover, the combined signal is significantly more reliable than either alone.
MACD + Moving Averages: Use a 200-period moving average as a trend filter. Only act on bullish MACD crossovers when price is above the 200 MA, and only act on bearish crossovers when price is below. This simple filter eliminates many false signals that occur in counter-trend moves.
MACD + Bollinger Bands: Bollinger Bands measure volatility, while MACD measures momentum. When price touches the lower Bollinger Band and MACD shows bullish divergence, the combination provides a strong buy signal. The bands define the price extreme, and MACD confirms that momentum is shifting.
MACD + Volume: Always check volume when acting on MACD signals. A bullish MACD crossover accompanied by increasing volume is far more reliable than one with declining volume. Volume confirms that real buying or selling pressure is behind the move.
MACD on Different Timeframes
MACD signals carry different weight depending on the timeframe you are analyzing. Understanding this hierarchy helps you avoid acting on low-quality signals.
Weekly MACD signals are the most significant. A bullish crossover on the weekly chart suggests a trend change that could last weeks or months. These signals are rare but highly reliable. Institutional traders and fund managers pay close attention to weekly MACD crossovers.
Daily MACD is the most commonly used timeframe. Signals here are suitable for swing trading and can produce trends lasting from several days to a few weeks. The daily MACD strikes the best balance between signal quality and frequency.
Intraday MACD (1-hour, 15-minute, 5-minute) produces frequent signals suitable for day trading. However, these signals are less reliable in isolation and should always be confirmed by higher timeframe analysis or additional indicators like VWAP.
A powerful approach is multi-timeframe MACD analysis. Check the weekly MACD for the primary trend direction, the daily MACD for the intermediate trend, and the intraday MACD for entry timing. Only take trades where all timeframes align.
Common MACD Mistakes
Ignoring the trend context. MACD crossovers in choppy, sideways markets produce many false signals. Before acting on a MACD signal, determine whether the market is trending or ranging. In ranging markets, oscillators like RSI or the stochastic oscillator may be more appropriate.
Treating every crossover as a trade signal. Not all crossovers lead to sustained moves. Crossovers that occur near the zero line in a flat market are particularly unreliable. Focus on crossovers that occur after a clear divergence or at extreme levels away from zero.
Using MACD alone. Despite its versatility, MACD should not be your sole decision-making tool. It is a lagging indicator by nature, meaning it confirms trends after they have begun. Pair it with leading indicators, price action analysis, and proper risk management.
Forgetting about the histogram. Many traders focus exclusively on the MACD and signal line crossovers while ignoring the histogram. The histogram provides the earliest momentum signals and can improve your entry timing significantly.
MACD Trading Plan Template
A structured trading plan helps you use MACD consistently and objectively. Here is a template you can adapt.
Define your trend filter first: check the 200 EMA or the weekly MACD direction. Next, wait for a MACD signal that aligns with that trend. Confirm the signal with at least one other factor — RSI confirmation, volume increase, price at a key level, or a chart pattern. Set your stop-loss below the recent swing low for long trades or above the recent swing high for shorts. Use the ATR indicator to ensure your stop is not too tight for the current volatility. Finally, target the next significant resistance or support level for your profit target, aiming for at least a 2:1 reward-to-risk ratio.
Frequently Asked Questions
What does MACD stand for?
MACD stands for Moving Average Convergence Divergence. The name describes exactly what the indicator does — it measures when two moving averages are converging (coming together) or diverging (moving apart). When the short-term moving average pulls away from the long-term average, it shows accelerating momentum. When they converge, momentum is decelerating. Gerald Appel designed the indicator to capture these dynamics in a simple visual format.
Is MACD a leading or lagging indicator?
MACD is fundamentally a lagging indicator because it is built from moving averages, which are based on past price data. However, certain MACD signals can have leading characteristics. MACD divergence, for example, often appears before a price reversal occurs. The histogram can also provide early warnings of momentum shifts before the actual crossover happens. For this reason, many traders classify MACD as a coincident indicator that offers some predictive value through divergence analysis.
What is the best MACD setting for day trading?
For day trading, many traders use faster MACD settings such as (8, 17, 9) or (5, 13, 1) to increase signal responsiveness. The standard (12, 26, 9) settings can also work on intraday charts like the 5-minute or 15-minute timeframe. The best approach is to test different settings on your specific market and timeframe using historical data. Regardless of settings, always combine intraday MACD with a higher-timeframe trend filter and volume analysis to reduce false signals.
How do you use MACD for swing trading?
For swing trading, use the standard (12, 26, 9) MACD settings on the daily chart. Look for bullish crossovers below zero to buy and bearish crossovers above zero to sell short. Confirm signals with RSI (look for oversold or overbought conditions), check that volume supports the move, and ensure the trade aligns with the longer-term trend visible on the weekly chart. Enter after the crossover candle closes, set your stop below the recent swing low, and target the next resistance level.
Can MACD work in all market conditions?
MACD works best in trending markets where momentum builds in one direction. In choppy, sideways markets, MACD produces frequent crossovers that result in whipsaw losses. To handle this limitation, check the ADX indicator to confirm trend strength before relying on MACD signals — ADX readings above 25 suggest a strong enough trend for MACD to be effective. In ranging markets, consider switching to oscillators like RSI or stochastic that are better suited for mean-reversion conditions.
Disclaimer
This is educational content, not financial advice. Trading involves risk, and you should consult a qualified financial advisor before making any investment decisions. Past performance does not guarantee future results.
Related Articles
12 chapters covering charts, indicators, risk management & more. Plus weekly trading insights.