Chaikin Money Flow (CMF): Measuring Buying & Selling Pressure
⚡ Key Takeaways
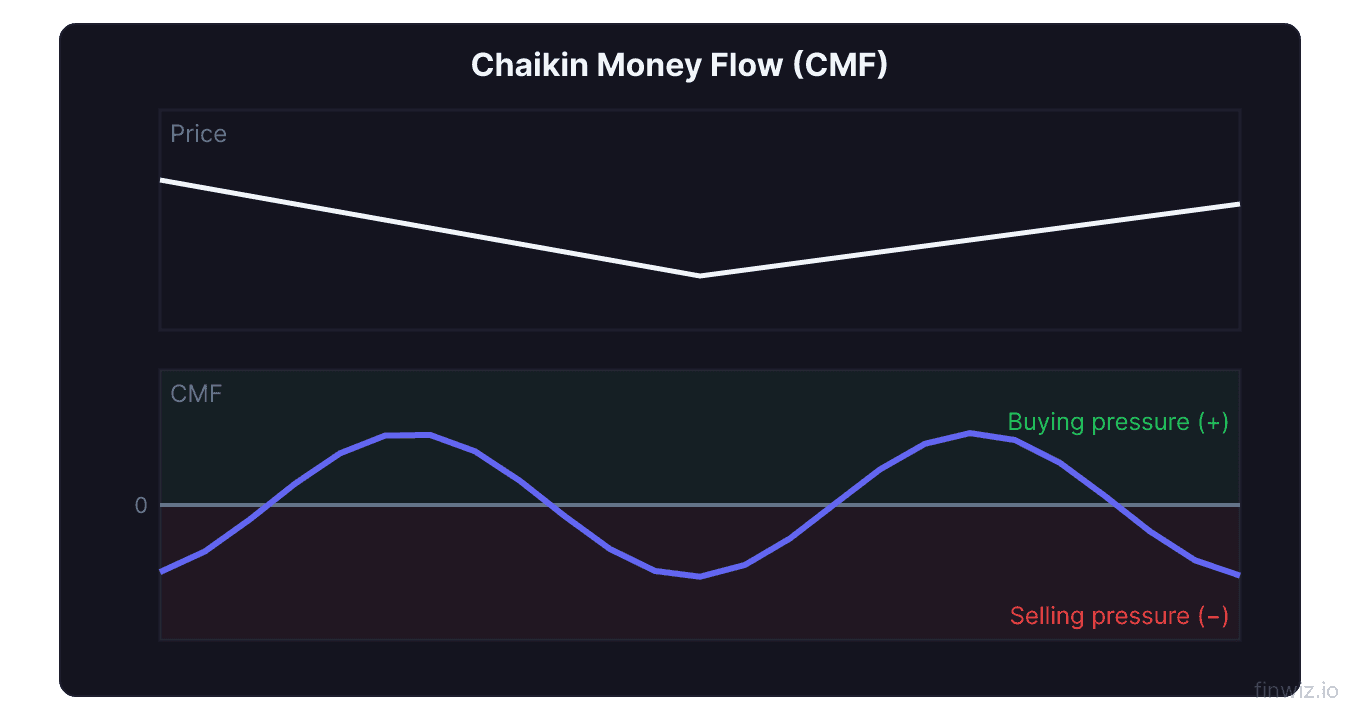
- Chaikin Money Flow (CMF) combines price and volume to measure accumulation (buying pressure) and distribution (selling pressure), producing a bounded oscillator between -1 and +1 that is easier to interpret than cumulative indicators like OBV or the A/D line.
- Zero-line crossovers are the most important CMF signals: crossing above zero indicates a shift to net accumulation (bullish), while crossing below zero indicates a shift to net distribution (bearish), especially when aligned with the broader trend.
- CMF divergence from price is one of the most reliable early warning signals for reversals, particularly when it develops gradually over multiple weeks at key support or resistance levels.
- CMF works best as a confirmation tool rather than a standalone signal, adding value by validating breakouts (CMF above zero supports follow-through) and confirming trend health (persistent positive readings during uptrends).
- The default 21-period setting captures approximately one trading month of money flow behavior, but shorter periods (10) suit day trading while longer periods (50-100) provide a clearer view for position trading and investing.
What Is Chaikin Money Flow?
Chaikin Money Flow (CMF) is a technical indicator developed by Marc Chaikin that measures the amount of money flowing into or out of a security over a specified period. It combines price action and volume to determine whether a security is under accumulation (buying pressure) or distribution (selling pressure).
CMF is built on the same concept as the Accumulation/Distribution (A/D) line — it uses the Close Location Value (CLV) to determine whether each session's volume should be classified as buying or selling. However, while the A/D line is cumulative and unbounded, CMF applies the calculation over a fixed lookback period (typically 21 trading days) and normalizes the result, producing a bounded oscillator that fluctuates between -1 and +1.
This bounded nature makes CMF easier to interpret than the A/D line because you can immediately see whether current money flow is positive or negative, and compare readings across different securities and time periods.
The CMF Formula
CMF is calculated in three steps.
Step 1: Close Location Value (CLV)
CLV = ((Close - Low) - (High - Close)) / (High - Low)Step 2: Money Flow Volume
Money Flow Volume = CLV × VolumeThis weights each session's volume by where the close fell within the range. A high-volume session with a close near the high produces a large positive Money Flow Volume, while a high-volume session closing near the low produces a large negative value.
Step 3: CMF Calculation
CMF = Sum of Money Flow Volume over N periods / Sum of Volume over N periodsThe normalization (dividing by total volume) bounds the indicator between -1 and +1 and removes the scale dependency, allowing you to compare CMF readings across securities with vastly different volume levels.
Pro Tip
Interpreting CMF Readings
Positive CMF (Above Zero)
When CMF is above zero, the sum of money flow over the lookback period is positive, meaning closes have consistently been in the upper half of the daily range. This indicates accumulation — buying pressure dominates.
The further above zero, the stronger the buying pressure. CMF readings above +0.25 are considered notably strong accumulation.
Negative CMF (Below Zero)
When CMF is below zero, closes have consistently been in the lower half of the daily range, indicating distribution — selling pressure dominates.
CMF readings below -0.25 indicate notably strong selling pressure.
Zero Line Crossovers
The zero line is the most important reference level for CMF:
- CMF crossing above zero: Money flow shifts from net distribution to net accumulation — bullish signal
- CMF crossing below zero: Money flow shifts from net accumulation to net distribution — bearish signal
These crossovers are most meaningful when they occur in the direction of the broader trend or at key support/resistance levels.
| CMF Reading | Interpretation | Signal Strength |
|---|---|---|
| +0.25 to +1.0 | Strong accumulation | Very bullish |
| +0.05 to +0.25 | Moderate accumulation | Mildly bullish |
| -0.05 to +0.05 | Neutral / balanced | No signal |
| -0.25 to -0.05 | Moderate distribution | Mildly bearish |
| -1.0 to -0.25 | Strong distribution | Very bearish |
CMF and Trend Confirmation
CMF's primary role in many trading systems is confirming the health of existing trends.
Uptrend Confirmation
During an uptrend, healthy buying pressure keeps CMF persistently above zero. If CMF remains positive throughout a rally, the uptrend has strong volume support and is likely to continue. Watch for CMF readings that stay above +0.10 as a sign of consistent accumulation.
Downtrend Confirmation
During a downtrend, persistent distribution keeps CMF below zero. Continuous negative CMF readings confirm that selling pressure is driving the decline and the downtrend is likely to continue.
Weakening Trends
When CMF begins approaching zero from a positive reading during an uptrend, the buying pressure is fading. Similarly, CMF moving toward zero from a negative reading during a downtrend suggests selling pressure is diminishing. These shifts often precede visible trend changes.
Divergence Signals
Like its parent indicator, the A/D line, CMF's most powerful signals come from divergence with price.
Bullish CMF Divergence
Price makes lower lows while CMF makes higher lows (or moves toward positive territory). This reveals that despite declining prices, money flow is improving. Accumulation is occurring beneath the surface, often by institutional traders.
Bullish CMF divergence is especially powerful when it develops at key support levels, near oversold RSI readings, or at the completion zone of chart patterns like double bottoms.
Bearish CMF Divergence
Price makes higher highs while CMF makes lower highs (or moves toward negative territory). Money is flowing out of the security despite rising prices. This distribution often precedes significant price declines.
Bearish divergence at resistance levels, near overbought RSI readings, or during the formation of patterns like head and shoulders tops provides high-confidence warning signals.
Pro Tip
Trading Strategies with CMF
Zero-Line Crossover Strategy
Buy signal: CMF crosses above zero while price is above a rising moving average (e.g., 50-day MA). This confirms that both trend and money flow align in the bullish direction.
Sell signal: CMF crosses below zero while price is below a declining moving average. This confirms bearish alignment between trend and money flow.
Filter: Ignore zero-line crossovers that occur against the dominant trend. Only trade crossovers that align with the higher-timeframe trend direction.
Breakout Confirmation Strategy
When price breaks out from a chart pattern (e.g., ascending triangle, bull flag, cup and handle):
- Check CMF at the breakout
- CMF above zero: The breakout has volume support and is more likely to follow through
- CMF below zero: The breakout lacks volume support and is more likely to fail
This simple filter can dramatically improve breakout trading results by avoiding false breakouts that are not backed by genuine accumulation.
CMF with RSI Strategy
Combine CMF money flow analysis with RSI momentum analysis:
- Buy: RSI crosses above 30 (leaving oversold) AND CMF is positive or rising
- Sell: RSI crosses below 70 (leaving overbought) AND CMF is negative or falling
- Avoid: RSI signals that conflict with CMF readings
CMF Period Settings
| Period | Use Case | Sensitivity | Noise Level |
|---|---|---|---|
| 10 | Short-term / day trading | High | Higher |
| 21 | Standard / swing trading | Moderate | Moderate |
| 50 | Position trading | Low | Lower |
| 100 | Investing / long-term | Very low | Minimal |
The 21-period default works well for most swing traders. Shorter periods make CMF more responsive but generate more false signals. Longer periods produce smoother, more reliable signals but introduce lag.
CMF vs. Other Volume Indicators
| Indicator | Type | Bounded? | Best For |
|---|---|---|---|
| CMF | Period-based average | Yes (-1 to +1) | Comparative money flow analysis |
| A/D Line | Cumulative | No | Long-term accumulation trends |
| OBV | Cumulative | No | Volume trend direction |
| MFI | Period-based oscillator | Yes (0-100) | Overbought/oversold volume |
| VWAP | Price-weighted average | No | Fair value during session |
CMF's unique advantage is its bounded, period-based format that makes it easy to compare across securities and identify extreme readings. It is the most readable of the volume-based indicators for assessing whether money is flowing in or out.
Common Mistakes
Treating CMF as a standalone signal. CMF works best as a confirmation tool combined with price action, chart patterns, and other indicators. Zero-line crossovers alone do not constitute a robust trading strategy.
Ignoring the trend. CMF below zero during a strong uptrend may simply reflect normal pullback behavior, not distribution. Always contextualize CMF readings within the broader trend.
Using extreme readings as contrarian signals. Unlike oscillators such as RSI, CMF extreme readings (+0.4, -0.4) do not necessarily indicate overbought/oversold conditions. Strong trends can maintain extreme CMF readings for extended periods.
Comparing absolute CMF values across securities. While CMF is bounded, the typical range varies by security. A stock that routinely shows CMF of +0.10 is experiencing relatively strong accumulation for its norm, even if another stock regularly shows CMF of +0.20.
Frequently Asked Questions
What is a good CMF reading?
There is no universally "good" CMF reading. In general, CMF consistently above +0.05 during an uptrend confirms healthy buying pressure, and CMF consistently below -0.05 during a downtrend confirms selling pressure. Readings above +0.25 or below -0.25 are notably strong.
Can CMF predict reversals?
CMF does not predict reversals directly, but CMF divergence from price is one of the most reliable early warning signals for reversals. When CMF moves in the opposite direction of price over multiple weeks, it signals a shift in institutional behavior that often precedes a price reversal.
Is CMF better than OBV?
They complement each other rather than compete. CMF provides a bounded, period-based view that is easier to interpret at a glance, while OBV provides a cumulative view that captures the full volume history. Using both together provides the most complete volume analysis.
What happens when CMF stays near zero?
A CMF reading near zero indicates that buying and selling pressure are roughly balanced. This often coincides with sideways price action or consolidation phases. The next decisive move away from zero — combined with a price breakout — can signal the beginning of a new trend.
Can I use CMF on weekly or monthly charts?
Yes. CMF on weekly or monthly charts provides a longer-term view of institutional money flow. A weekly CMF that remains positive for months indicates sustained institutional accumulation, which is bullish for long-term positions.
How does CMF relate to the Chaikin Oscillator?
The Chaikin Oscillator is a different indicator that measures the momentum of the A/D line by calculating the difference between a fast and slow EMA of the A/D line. While both were developed by Marc Chaikin and share the CLV concept, they measure different aspects of volume-price relationships.
Disclaimer
This is educational content, not financial advice. Trading involves risk, and you should consult a qualified financial advisor before making any investment decisions. Past performance does not guarantee future results.
12 chapters covering charts, indicators, risk management & more. Plus weekly trading insights.