Volume Analysis: What Volume Tells You About a Stock's Move
⚡ Key Takeaways
- Volume measures the total number of shares traded in a given period and confirms the strength of price moves
- Rising price on rising volume confirms a healthy trend; rising price on declining volume warns of weakness
- Climax volume, an extreme spike in trading activity, often marks significant turning points in price
- Dry-up volume, abnormally low trading activity, frequently precedes a major breakout in either direction
- Volume should be analyzed relative to a stock
Why Volume Matters in Trading
Volume is the number of shares exchanged between buyers and sellers during a specific time period. It is the fuel that drives price movement. Without volume, price moves lack conviction and are more likely to reverse.
Many traders focus exclusively on price while ignoring volume, and this is a significant mistake. Volume provides context that price alone cannot. A stock that rallies 5% on twice its average volume tells a very different story than one that rallies 5% on half its average volume.
The first scenario suggests strong institutional participation and genuine demand. The second suggests a thin-market move that could easily be reversed. Learning to read volume transforms your chart reading from two-dimensional to three-dimensional.
Volume Confirms Price Movements
The most important volume principle is confirmation. Volume should move in the direction of the trend to confirm its validity.
In an uptrend:
- Volume should increase on up days and decrease on down days
- This pattern shows that buyers are aggressive and sellers are passive
- If volume starts increasing on down days, the uptrend may be weakening
In a downtrend:
- Volume should increase on down days and decrease on up days
- This pattern confirms sellers are in control
- If volume picks up on up days, the downtrend may be losing steam
When price and volume diverge, it is a warning signal. A stock making new highs on progressively lower volume is a classic bearish divergence pattern that often precedes a reversal.
Pro Tip
Climax Volume
Climax volume occurs when a stock experiences an extreme spike in trading activity, often several times its daily average. Climax volume typically appears at the end of extended moves and signals exhaustion.
Selling Climax
A selling climax happens after a prolonged decline. The stock drops sharply on massive volume as panic sellers dump their shares. This extreme selling exhausts the supply, and once the panic subsides, a reversal or bottoming process begins.
Characteristics of a selling climax:
- Volume is 3 to 10 times the daily average
- The price drops sharply, often on a wide-range candle
- A long lower wick may form as buyers absorb the panic selling
- The stock often reverses or enters a consolidation phase afterward
Buying Climax
A buying climax occurs after an extended rally. The stock surges on enormous volume as latecomers rush to buy. This frenzy exhausts demand, and once the euphoria fades, the price stalls or reverses.
Characteristics of a buying climax:
- Volume spikes to extreme levels near the highs
- The price may gap up or produce a very wide-range bullish candle
- A long upper wick may form as sellers step in at the highs
- The stock frequently pulls back or reverses from this point
Pro Tip
Dry-Up Volume
Dry-up volume is the opposite of climax volume. It occurs when trading activity drops to abnormally low levels, often 50% or more below the daily average. Dry-up volume frequently appears during consolidation periods and can signal that a significant move is about to begin.
Why dry-up volume precedes breakouts:
- Low volume means neither buyers nor sellers are motivated at current prices
- This equilibrium cannot last forever; one side will eventually step in
- When the balance tips, the resulting move is often explosive because there is little opposing interest to absorb it
- Dry-up volume during a pullback within an uptrend is especially bullish because it shows sellers lack conviction
When you see a stock forming a tight consolidation pattern near resistance with declining volume, watch closely. A breakout on a surge in volume often follows.
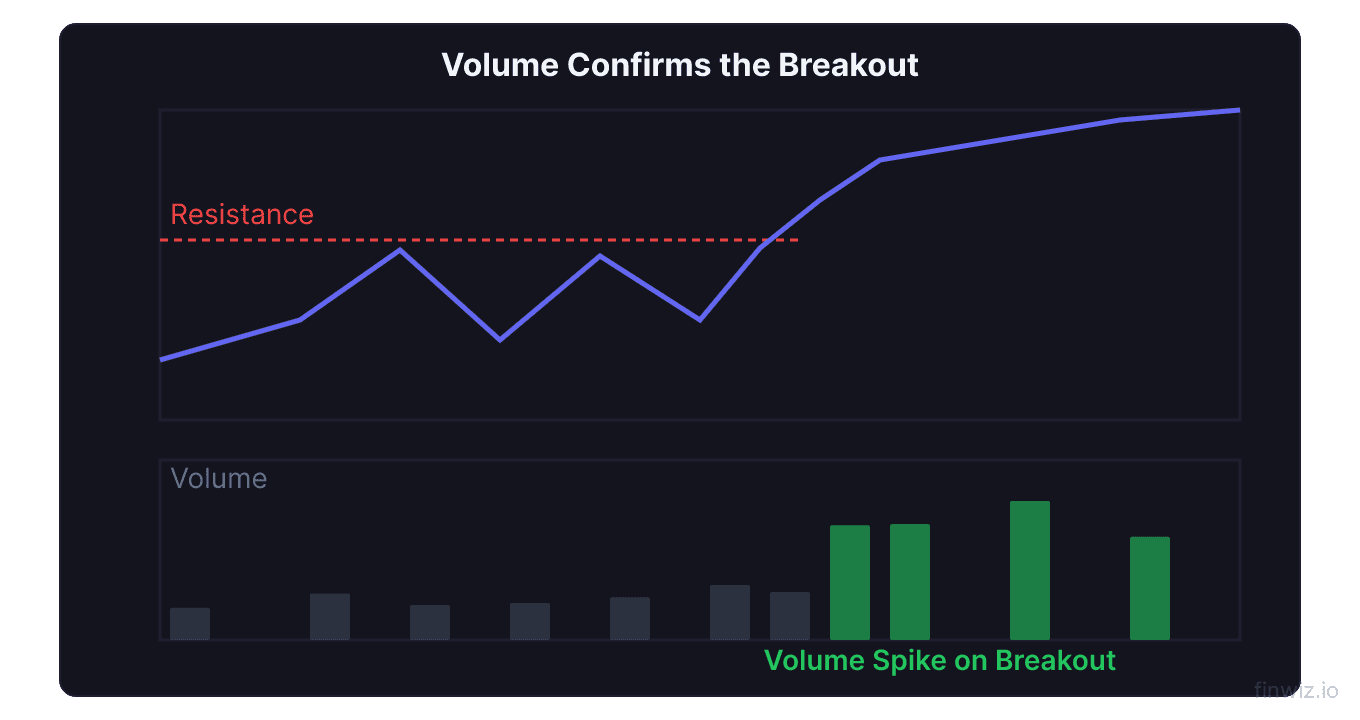
Volume and Breakouts
Volume is the single most important confirming factor for breakout trades. A breakout above resistance on heavy volume has a much higher probability of success than one on light volume.
Rules for using volume with breakouts:
- Volume should spike on the breakout candle: Look for at least 1.5 to 2 times the average volume
- Volume should decline on the pullback: After the breakout, a pullback on low volume confirms that sellers are not aggressively opposing the move
- Volume should return on continuation: When the price resumes moving in the breakout direction, volume should pick up again
A breakout on low volume is often a false breakout. The price may briefly exceed the resistance level but then fall back inside the range as there is not enough participation to sustain the move.
On-Balance Volume (OBV)
On-Balance Volume (OBV) is a cumulative volume indicator that adds volume on up days and subtracts volume on down days. It was developed by Joe Granville and is one of the most straightforward volume indicators.
If today's close > yesterday's close: OBV = Previous OBV + Today's VolumeThe absolute value of OBV does not matter. What matters is the direction. If OBV is rising, volume is heavier on up days, confirming bullish pressure. If OBV is falling, volume is heavier on down days, confirming bearish pressure.
OBV divergence is particularly powerful. If the price makes a new high but OBV does not, it suggests the rally is running out of steam. If the price makes a new low but OBV does not, it suggests selling pressure is waning.
Volume-Weighted Average Price (VWAP)
VWAP calculates the average price weighted by volume. It is widely used by institutional traders and day traders as a benchmark for intraday trading.
VWAP = Cumulative (Price x Volume) / Cumulative VolumeVWAP acts as dynamic support and resistance during the trading day. Institutional traders often aim to buy below VWAP and sell above VWAP. If a stock is trading above VWAP, buyers are in control. If it is trading below, sellers dominate.
Day traders use VWAP as a directional bias tool. They look for long setups when price is above VWAP and short setups when price is below.
Relative Volume (RVOL)
Relative volume compares current volume to the stock's average volume over a specified period. It normalizes volume across different stocks and different times of day.
RVOL = Current Volume / Average Volume (over N periods)An RVOL of 2.0 means the stock is trading at twice its typical volume. An RVOL of 0.5 means it is trading at half its typical volume. Day traders typically look for stocks with an RVOL of 2.0 or higher for active trading opportunities. Learn more in our guide to relative volume.
Volume Patterns to Watch
| Pattern | Description | Implication |
|---|---|---|
| Rising price + rising volume | Trend confirmation | Bullish continuation likely |
| Rising price + declining volume | Divergence warning | Trend weakening, reversal possible |
| Falling price + rising volume | Selling pressure increasing | Bearish continuation likely |
| Falling price + declining volume | Selling pressure waning | Bounce or reversal possible |
| Volume spike at support | Buyers stepping in | Support likely to hold |
| Volume spike at resistance | Sellers stepping in | Resistance likely to hold |
| Volume dry-up in consolidation | Equilibrium | Breakout imminent |
Common Volume Analysis Mistakes
- Comparing volume across stocks: A stock that trades 500,000 shares daily and a stock that trades 50 million shares daily cannot be compared on raw volume. Always use relative volume.
- Ignoring time of day: Volume is naturally higher at the open and close of the trading day. Comparing midday volume to opening volume without adjustment leads to incorrect conclusions.
- Treating all volume equally: Not all volume is created equal. Volume at key support and resistance levels is more significant than volume in the middle of a range.
- Using volume in isolation: Volume is a confirmation tool, not a standalone signal. Always combine volume analysis with price action and other indicators.
Frequently Asked Questions
What is considered high volume for a stock?
High volume is relative to each stock's own average. A general benchmark is 1.5 to 2 times the 20-day average volume or higher. For day traders scanning for active stocks, an RVOL of 2.0 or greater is a common filter.
Can I use volume analysis for cryptocurrencies?
Volume analysis applies to any market with reliable volume data. Cryptocurrency exchanges report volume, though the accuracy can vary between exchanges. The principles of confirmation, climax, and dry-up volume all apply, but be aware that some crypto volume data may be inflated.
Why does volume spike at the market open and close?
The opening bell sees accumulated overnight orders being executed, creating a surge. The closing minutes see institutional traders and algorithms completing daily execution targets, plus traders squaring positions before the close. The midday period typically has the lowest volume as many traders step aside.
What is the difference between volume and open interest?
Volume counts the number of shares or contracts traded in a period. Open interest is specific to futures and options and counts the total number of outstanding contracts. Volume shows activity; open interest shows commitment. Both are useful but measure different things.
Should I trade stocks with low volume?
Trading low-volume stocks carries significant risk. The bid-ask spread is typically wider, making it more expensive to enter and exit positions. Slippage can be severe, and it may be difficult to sell your shares at a desired price. Most active traders set a minimum daily volume threshold, such as 500,000 shares per day.
Disclaimer
This is educational content, not financial advice. Trading involves risk, and you should consult a qualified financial advisor before making any investment decisions. Past performance does not guarantee future results.
Related Articles
12 chapters covering charts, indicators, risk management & more. Plus weekly trading insights.