What Is a Trend? Uptrends, Downtrends & Sideways Markets
⚡ Key Takeaways
- An uptrend is defined by a series of higher highs and higher lows on the price chart
- A downtrend is defined by a series of lower highs and lower lows
- A sideways market (range) occurs when price oscillates between defined support and resistance without making directional progress
- Trend identification is the foundation of all technical trading — the direction of the trend determines which strategies to use
- Trends exist on every time frame, and aligning your trades with the dominant trend dramatically improves your odds
Why Trends Matter
Trend identification is the single most important skill in technical analysis. Before you select an indicator, draw a pattern, or calculate a target, you need to answer one question: what is the trend? The trend tells you which side of the market has control, and trading with that side puts the probabilities in your favor.
The saying "the trend is your friend" is repeated so often that it has become a cliché, but the data supports it. Stocks in established uptrends are statistically more likely to continue rising than to reverse. Stocks in downtrends are more likely to keep falling. Fighting the trend — buying in a downtrend or shorting in an uptrend — is how most traders accumulate losses.
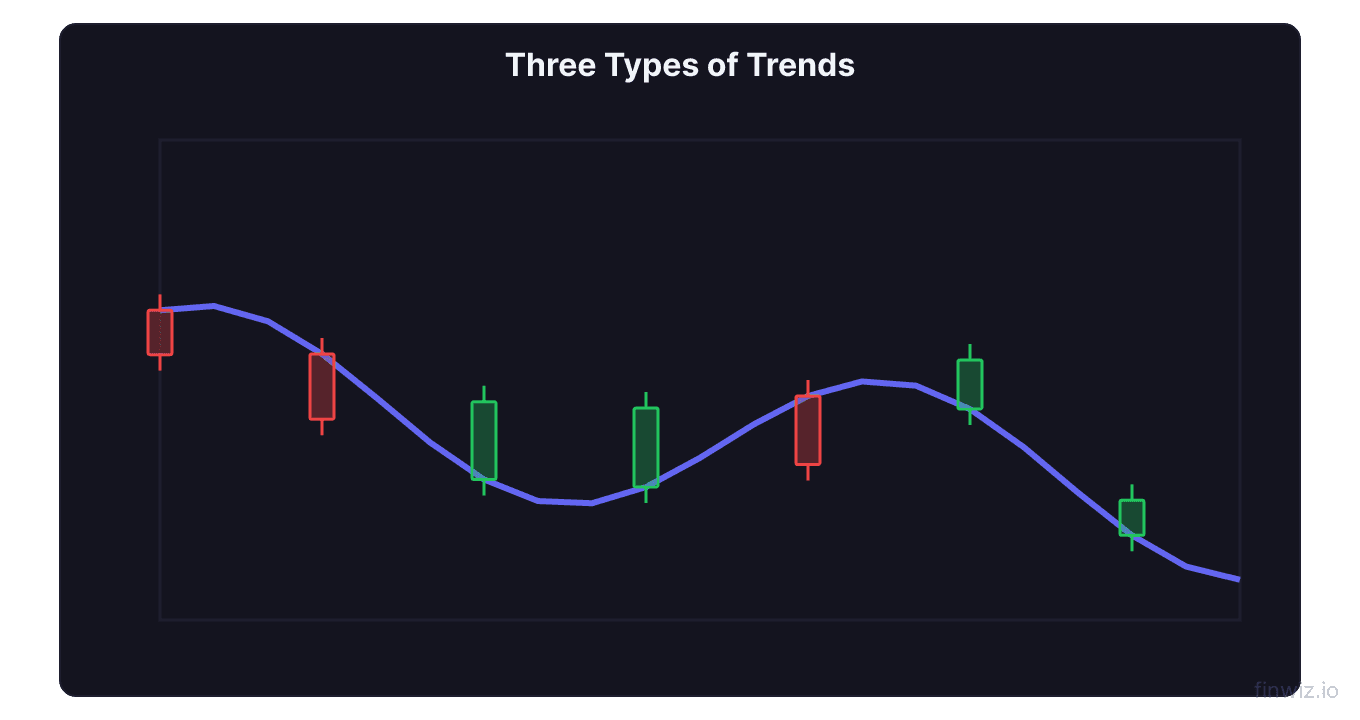
The three types of trends are uptrend, downtrend, and sideways (also called a range or consolidation). Each requires a different trading approach, and recognizing when one trend type transitions into another is where the real edge lies.
Uptrends: Higher Highs and Higher Lows
An uptrend exists when price forms a sequence of higher highs and higher lows. Each rally reaches a new peak that exceeds the previous peak, and each pullback finds a bottom that is higher than the previous bottom.
This structure reveals an important dynamic: buyers are willing to pay more on each successive rally, and sellers are unable to push the price back to prior lows. Demand consistently overwhelms supply.
SPY from late 2023 through early 2024 demonstrated a textbook uptrend. Each pullback found support at a level higher than the previous low, and each rally extended beyond the prior high. Traders who recognized this structure and bought the pullbacks captured substantial gains.
You can draw trend lines along the higher lows to visualize the uptrend's support structure. As long as price respects this rising trend line, the uptrend remains intact. A decisive break below the trend line — especially on increased volume — signals a potential trend change.
Pro Tip
Downtrends: Lower Highs and Lower Lows
A downtrend is the mirror image of an uptrend. Price forms a series of lower highs and lower lows. Each rally fails to reach the previous peak, and each decline pushes to a new low.
This structure tells you that sellers are in control. Buyers attempt to rally the price, but they are overwhelmed at progressively lower levels. Supply consistently exceeds demand.
AAPL during the second half of 2022 showed a clear downtrend. The stock formed a series of lower highs from July through December, with each bounce failing below the previous one. Traders who shorted the rallies or avoided long positions during this period avoided significant drawdowns.
Key characteristics of a healthy downtrend:
- Each rally attempt is weaker than the last (lower volume, shorter duration)
- Declines occur on increasing or steady volume
- The stock trades below its major moving averages (50-day, 200-day)
- The ADX reading is above 25, confirming directional strength
Downtrend Confirmation = Lower High below Previous Lower High + Lower Low below Previous Lower LowA downtrend ends when the stock makes a higher low followed by a higher high, breaking the sequence. This is the first structural signal that sellers are losing control and a potential reversal is forming.
Sideways Markets: The Range
A sideways market occurs when price trades within a horizontal range, bouncing between support and resistance without making sustained directional progress. Neither buyers nor sellers can gain lasting control.
Sideways markets frustrate trend-following traders because breakout attempts fail and momentum signals whipsaw. However, range-bound conditions are highly profitable for traders who recognize them and adapt their strategy accordingly.
The SPY spent much of the second quarter of 2024 in a sideways range, consolidating gains from the prior uptrend. During this period, buying near support and selling near resistance was far more effective than chasing breakouts.
Identifying a sideways market requires at least two touches of both the upper and lower boundaries. The more times price tests a level without breaking through, the more defined the range becomes — and the more significant the eventual breakout will be.
Volume is a useful confirming tool. In a sideways market, volume typically contracts as the range develops. This declining volume signals indecision and a lack of conviction from both sides. When volume expands sharply at one of the boundaries, it often signals the beginning of a breakout and the end of the range.
How to Determine the Trend on Any Time Frame
Trends exist on every time frame. The daily chart might show an uptrend while the 5-minute chart shows a downtrend. This is not a contradiction — it simply reflects different time horizons.
A practical approach is to use the higher time frame for trend direction and the lower time frame for entry timing. If the weekly chart shows an uptrend, look for long entries on the daily or 4-hour chart. This alignment ensures you are trading with the larger trend while optimizing your entry.
Three methods to objectively identify the trend:
Price structure — The higher highs/higher lows or lower highs/lower lows method described above. This is the purest form of trend identification.
Moving averages — Price above the 200-day moving average suggests an uptrend. Price below suggests a downtrend. The slope of the moving average confirms the trend's direction and strength.
ADX indicator — The ADX measures trend strength regardless of direction. ADX above 25 indicates a trending market. ADX below 20 indicates a sideways or weak market. Combining ADX with the directional indicators (+DI and -DI) tells you both the strength and the direction.
Pro Tip
When Trends Change
Trend changes do not happen instantly. They follow a progression: the existing trend weakens, a transitional period develops (often a sideways range), and eventually a new trend emerges in the opposite direction.
Warning signs that an uptrend is weakening:
- The latest higher high was made on declining volume
- The pullbacks are becoming deeper (retracing more of the prior rally)
- The stock breaks below its rising trend line
- Moving averages begin to flatten and converge
Warning signs that a downtrend is weakening:
- The latest lower low was made on declining volume with a quick recovery
- Rallies are lasting longer and covering more ground
- The stock breaks above its descending trend line
- Volume increases on rallies and decreases on declines
Recognizing these transitions early allows you to adjust your approach — tightening stops in a weakening uptrend or looking for reversal entries as a downtrend exhausts itself.
FAQ
How many higher highs and higher lows are needed to confirm an uptrend?
A minimum of two higher highs and two higher lows establishes a basic uptrend structure. However, the more data points that confirm the pattern, the stronger the trend. Most traders look for at least three successive higher lows before committing significant capital to the long side.
Can a stock be in an uptrend on the daily chart and a downtrend on the weekly chart?
Yes. This happens when a stock is experiencing a short-term rally within a larger downtrend. The daily uptrend is a counter-trend move. These trades can be profitable but carry higher risk because the larger trend is working against you. Always give the higher time frame more weight in your analysis.
What is the best indicator for identifying trends?
No single indicator is best for all conditions. Price structure (higher highs/higher lows) is the most reliable method. For confirmation, combine a moving average (such as the 50-day or 200-day) with the ADX. The moving average shows direction, and the ADX shows whether the trend has enough strength to trade confidently.
Related Articles
12 chapters covering charts, indicators, risk management & more. Plus weekly trading insights.