Reversal Patterns: How to Spot a Trend Change Early
⚡ Key Takeaways
- Reversal patterns signal that the current trend is losing momentum and a move in the opposite direction is likely
- The most reliable reversal patterns include head and shoulders, double tops and bottoms, and key candlestick formations like the morning star and evening star
- Divergence between price and momentum indicators is one of the earliest warning signs that a trend is exhausting
- Volume behavior during pattern formation is critical: declining volume on trend continuation and rising volume on reversal moves confirms the shift
- No single reversal pattern is sufficient on its own; combine pattern recognition with momentum, volume, and key support/resistance levels
What Are Reversal Patterns?
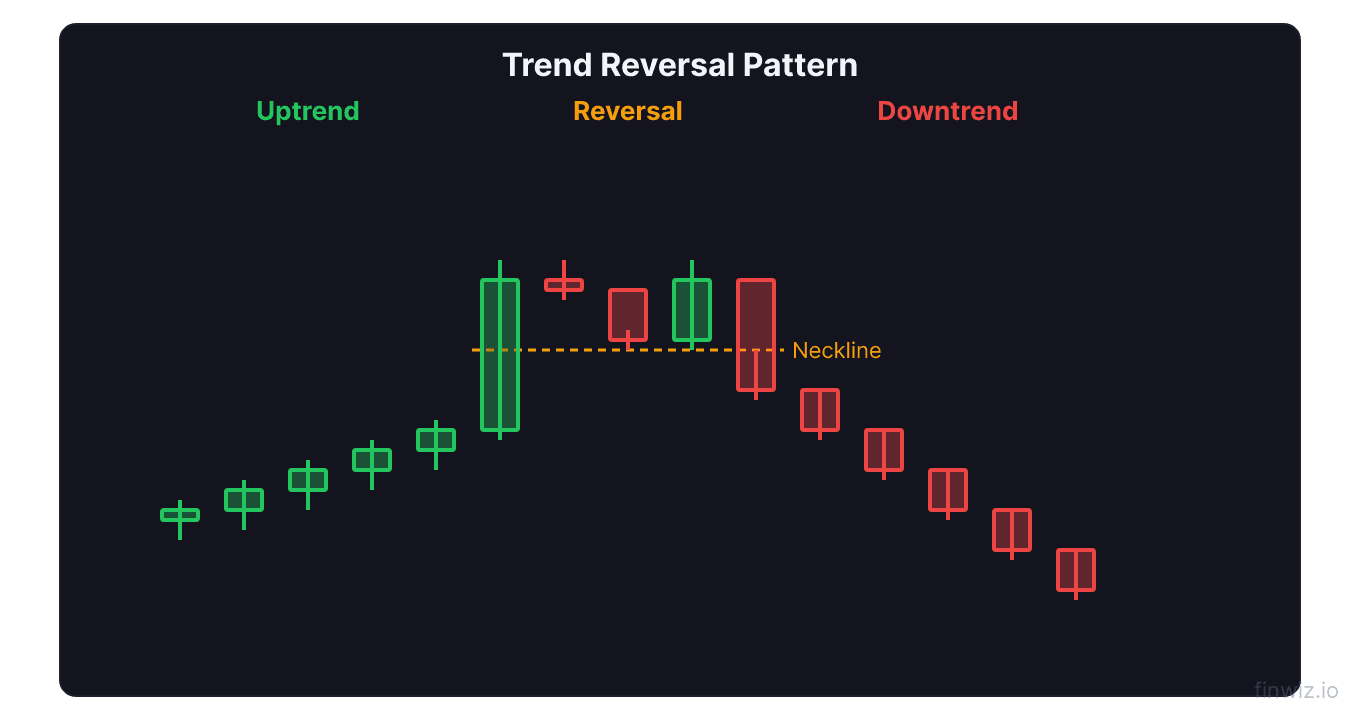
Reversal patterns are chart formations that indicate a trend is ending and price is about to move in the opposite direction. A bullish reversal pattern forms at the bottom of a downtrend and signals a potential move higher. A bearish reversal pattern forms at the top of an uptrend and signals a potential decline.
Understanding reversals matters because trends do not last forever. Every uptrend eventually rolls over, and every downtrend eventually bottoms out. Traders who can identify these turning points early gain a significant edge. They can exit existing positions before the bulk of the move against them occurs, or they can initiate new positions at the very beginning of a fresh trend.
The challenge is that not every pattern that looks like a reversal actually leads to one. Trends are persistent, and what appears to be a reversal can turn out to be a temporary pause before the trend resumes. This is why reversal patterns must be confirmed by volume, momentum, and a decisive break of key levels before you act on them.
The Reversal Framework: Four Conditions
Before looking at individual patterns, understand the framework that applies to all reversals. A genuine trend change typically meets four conditions:
1. An existing trend must be in place. You cannot have a reversal without a trend to reverse. A stock moving sideways does not produce reversal signals. Look for a clear series of higher highs and higher lows (uptrend) or lower highs and lower lows (downtrend).
2. A key level must break. In an uptrend, the first lower low breaks the pattern of higher lows. In a downtrend, the first higher high breaks the pattern of lower highs. This structural break is the earliest technical signal.
3. Momentum should diverge from price. When price makes a new high but RSI or MACD makes a lower high, that divergence warns that buying power is fading. Divergence often appears before the pattern itself completes.
4. Volume should confirm the shift. Volume should decline on moves in the old trend direction and increase on moves in the new direction. This shows the balance of power is changing hands.
Pro Tip
Major Chart Reversal Patterns
Several well-documented chart patterns signal reversals. Each has specific characteristics, completion criteria, and projected targets.
Head and Shoulders
The head and shoulders is widely considered the most reliable reversal pattern. It consists of three peaks: a left shoulder, a higher head, and a right shoulder that fails to reach the head's height. The pattern completes when price breaks below the neckline connecting the two troughs.
AAPL formed a textbook head and shoulders in late 2023 on the 4-hour chart before a 5% decline. The declining volume on the right shoulder compared to the head confirmed weakening momentum.
Double Top and Double Bottom
The double top and double bottom pattern shows price testing the same level twice and failing to break through. A double top is bearish, forming two peaks at approximately the same price. A double bottom is bullish, forming two troughs at approximately the same price.
SPY has produced several notable double bottoms at major support levels. The October 2023 double bottom near $410 launched a rally that carried the index to new all-time highs.
Rounding Patterns
Rounding tops and rounding bottoms form gradually over weeks or months. They lack the sharp structural features of a head and shoulders but signal the same thing: a slow shift in sentiment from one side to the other.
Candlestick Reversal Patterns
Single and multi-candle patterns provide early reversal signals at a more granular level. These work best when they appear at support or resistance levels or at the completion of a larger chart pattern.
The morning star and evening star are three-candle patterns that signal reversals at key turning points. A morning star forms at the bottom of a decline with a large red candle, a small-bodied indecision candle, and a large green candle that closes into the body of the first candle. The evening star is the bearish mirror image.
Other important single-candle reversals include the hammer, shooting star, engulfing patterns, and the doji at extremes. For a comprehensive guide to these formations, see the full candlestick patterns guide.
These candlestick signals are most powerful when they align with a larger reversal pattern. A hammer forming at the neckline of an inverse head and shoulders, for example, provides a high-confidence entry.
Using Divergence as an Early Warning System
Divergence is often the first sign that a reversal is approaching, appearing before the price pattern itself becomes visible. When price makes a new extreme but a momentum indicator does not confirm it, the trend is losing internal strength.
Bearish divergence occurs when price makes a higher high but RSI, MACD, or the stochastic oscillator makes a lower high. This appeared on NVDA multiple times during 2024, providing early warnings before 5-10% pullbacks.
Bullish divergence occurs when price makes a lower low but the indicator makes a higher low. This signals that selling pressure is waning even though price is still declining.
For a deep dive into divergence types, confirmation methods, and trading strategies, see the full divergence guide.
Divergence Signal Strength = Number of Indicator Divergences Across Multiple TimeframesHow to Confirm and Trade Reversals
Spotting a potential reversal pattern is only half the job. Confirmation and execution determine whether the signal produces a profit.
Wait for the break. Do not anticipate the pattern. A head and shoulders is not complete until the neckline breaks. A double bottom is not confirmed until the middle peak is exceeded. Trading before completion leads to losses when the pattern fails.
Volume must confirm. The breakout from the pattern should occur on above-average volume. A neckline break on low volume is suspect and more likely to fail.
Set targets using pattern measurement. Most reversal patterns project a minimum target equal to the height of the pattern. A head and shoulders with a 10-point height projects a 10-point decline from the neckline break.
Price Target = Neckline Break Price - Pattern Height (for bearish reversals)Use a stop loss. Place your stop on the other side of the pattern. For a head and shoulders breakdown, the stop goes above the right shoulder. For a double bottom breakout, the stop goes below the second low.
Pro Tip
FAQ
What is the most reliable reversal pattern?
The head and shoulders (and its inverse) has the highest documented success rate among classical reversal patterns, completing as expected roughly 80% of the time when all criteria are met. However, no pattern works in isolation. Confirm with volume, divergence, and the broader market context.
Can reversal patterns fail?
Every pattern can fail. A failed reversal means the prior trend resumes. This is why stop losses are non-negotiable. The failure rate increases when the pattern forms against a very strong trend or when volume does not confirm the pattern's completion.
How long do reversal patterns take to form?
Formation time varies by pattern and timeframe. A double bottom on a daily chart typically takes 3-8 weeks. A head and shoulders can take 1-3 months. Candlestick patterns form in 1-3 candles. Longer formation times generally produce more reliable signals because they reflect a more significant shift in supply and demand.
12 chapters covering charts, indicators, risk management & more. Plus weekly trading insights.