Wyckoff Trading Method: Reading the Market Like a Composite Man
⚡ Key Takeaways
- The Wyckoff method analyzes price and volume to identify institutional accumulation and distribution phases
- The
- concept frames the market as being driven by a single large operator whose intentions can be read through price-volume analysis
- Accumulation schematics include the Spring — a false breakdown that shakes out weak holders before a markup
- Distribution schematics include the Upthrust — a false breakout that traps buyers before a markdown
What Is the Wyckoff Method?
The Wyckoff method is a technical analysis framework developed by Richard D. Wyckoff in the early 1900s. It focuses on reading the intentions of large institutional traders through the analysis of price action and volume. Rather than relying on indicators, Wyckoff traders study the raw relationship between supply (selling) and demand (buying) to anticipate future price movements.
Wyckoff's approach is built on the premise that the market is not random — it is driven by informed institutional traders (the "smart money") who accumulate and distribute large positions in predictable patterns. By learning to recognize these patterns, individual traders can align their trades with institutional activity.
The method remains highly relevant today, more than a century after its creation. Many professional traders, hedge fund managers, and prop trading firms use Wyckoff principles as the foundation of their analysis. Its emphasis on supply and demand dynamics is timeless.
The Composite Man
Wyckoff introduced the concept of the Composite Man (or Composite Operator) — an imaginary single entity that represents all the large institutional players in the market. The Composite Man:
- Plans his campaigns in advance
- Accumulates shares at low prices by keeping the stock quiet and absorbing supply
- Marks up the price after accumulation is complete
- Distributes shares at high prices by attracting public buying
- Marks down the price after distribution is complete
By thinking in terms of the Composite Man's objectives, you can interpret price and volume action as the footprints of institutional activity. When volume surges on a decline but price barely falls, the Composite Man may be absorbing supply (accumulating). When volume surges on a rally but price stalls, he may be unloading shares (distributing).
Pro Tip
Wyckoff's Three Fundamental Laws
Law 1: Supply and Demand
Price moves based on the imbalance between supply (selling pressure) and demand (buying pressure). When demand exceeds supply, prices rise. When supply exceeds demand, prices fall. When they are in balance, prices move sideways (a trading range).
Volume analysis is the primary tool for gauging the balance. High volume on up moves with low volume on pullbacks suggests demand dominates. High volume on declines with low volume on rallies suggests supply dominates.
Law 2: Cause and Effect
Every price move (the effect) requires a preceding period of preparation (the cause). The size of the cause determines the magnitude of the effect. A long accumulation phase (large cause) produces a larger price advance than a short one (small cause).
Wyckoff Point and Figure Count:Law 3: Effort vs. Result
The effort (volume) should produce a proportional result (price movement). When high volume produces a large price move, effort and result are in harmony — the trend is likely to continue. When high volume produces little price movement, effort and result diverge — a change in direction may be imminent.
This law is particularly powerful for identifying turning points. A stock declining on massive volume but barely falling in price suggests strong demand is absorbing the supply — the Composite Man is likely accumulating.
The Accumulation Schematic
Wyckoff identified a specific sequence of events during institutional accumulation — the process of building a large position at low prices. The classic accumulation schematic includes these phases:
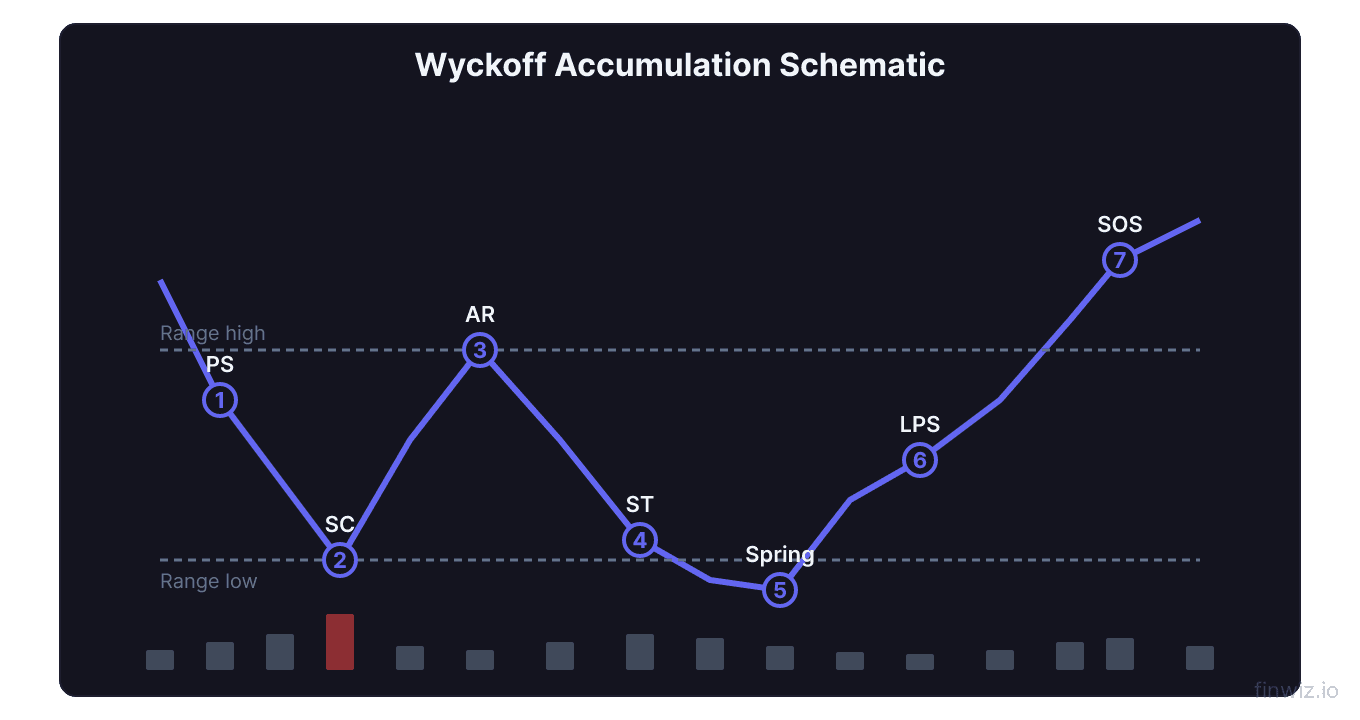
Phase A: Stopping the Downtrend
- Preliminary Support (PS): Significant buying appears after a prolonged decline, but it is not enough to stop the downtrend
- Selling Climax (SC): A dramatic, high-volume decline that marks the exhaustion of selling pressure. This is the panic low.
- Automatic Rally (AR): Price bounces from the SC as selling dries up. This rally establishes the upper boundary of the trading range.
- Secondary Test (ST): Price retests the SC area on decreased volume, confirming that selling pressure has been absorbed.
Phase B: Building the Cause
- The stock trades in a range between the SC/ST lows and the AR high
- Volume tests occur, gradually shifting the balance from supply to demand
- The Composite Man is absorbing remaining supply from sellers
Phase C: The Spring (or Test)
- The Spring: A brief break below the trading range support that quickly reverses. This is a shakeout designed to trigger stop losses and scare remaining weak holders into selling. The Spring is the most important Wyckoff event — it is often the ideal entry point.
- Volume on the Spring should be relatively low, indicating limited genuine selling
Phase D: Markup Begins
- Price breaks above the trading range with expanding volume
- Signs of Strength (SOS): Strong rallies on high volume confirm the markup has begun
- Last Point of Support (LPS): Brief pullbacks on low volume provide additional entry opportunities
Phase E: Markup
- The stock trends higher as the broader market recognizes the move
- The Composite Man's accumulation creates the foundation for a sustained advance
The Distribution Schematic
Distribution is the mirror image of accumulation. The Composite Man sells his accumulated position to eager buyers:
Phase A: Stopping the Uptrend
- Preliminary Supply (PSY): Heavy selling appears after a long advance, but is not enough to stop the uptrend
- Buying Climax (BC): A dramatic, high-volume rally that marks the exhaustion of buying power. This is the euphoria peak.
- Automatic Reaction (AR): Price drops from the BC as buying dries up, establishing the lower boundary of the range
- Secondary Test (ST): Price retests the BC area on decreased volume, confirming that demand has been exhausted
Phase B: Building the Cause
- The stock trades in a range as the Composite Man distributes shares
- The public buys enthusiastically while smart money sells
Phase C: The Upthrust (or UTAD)
- Upthrust After Distribution (UTAD): A brief break above the trading range resistance that quickly reverses. This traps breakout buyers who become immediate sellers when the stock reverses.
- The UTAD is the mirror of the Spring — a false move designed to wrong-foot traders
Phase D: Markdown Begins
- Signs of Weakness (SOW): Strong declines on high volume
- Last Point of Supply (LPSY): Brief rallies on low volume provide shorting opportunities
Phase E: Markdown
- The stock trends lower as the reality of supply overwhelming demand becomes clear
Applying Wyckoff to Modern Markets
Wyckoff's principles translate seamlessly to modern markets, including high-frequency trading environments:
Identify the trading range. When a stock stops trending and begins moving sideways, a Wyckoff event may be developing. Mark the upper and lower boundaries of the range.
Analyze volume within the range. Is volume higher on rallies within the range (demand) or on declines (supply)? This reveals whether accumulation or distribution is occurring.
Watch for the Spring or Upthrust. The false breakout/breakdown is the signature Wyckoff event. When you see a brief break of the range on low volume that quickly reverses, be prepared for the true move in the opposite direction.
Trade the breakout with confirmation. After the Spring (for longs) or UTAD (for shorts), wait for a Sign of Strength or Sign of Weakness with expanding volume before entering.
Wyckoff and Relative Strength
Wyckoff emphasized trading stocks that show relative strength versus the market. If the broad market is declining but your stock is holding firm within an accumulation range, this relative strength suggests institutional buying support.
Combining Wyckoff's structural analysis with relative strength screening narrows your universe to stocks where the Composite Man is most actively accumulating — providing the highest-probability setups.
Common Wyckoff Trading Mistakes
Labeling every trading range as accumulation or distribution. Not every sideways range is a Wyckoff event. Some are simply pauses with no significant institutional activity.
Anticipating the Spring before it occurs. Entering before the Spring means you may be buying into a genuine breakdown rather than a shakeout. Wait for the reversal to confirm.
Ignoring the broader market context. Wyckoff analysis works best when aligned with the market trend. An accumulation pattern is more reliable in a bull market or at bear market bottoms.
Focusing on price alone. Volume is equally important in Wyckoff analysis. A pattern without proper volume characteristics is not a valid Wyckoff setup.
FAQ
Is the Wyckoff method still effective in modern markets?
Yes. The Wyckoff method analyzes the fundamental dynamics of supply and demand, which have not changed since markets were created. Algorithmic trading and high-frequency trading have not altered the basic need for institutional investors to accumulate and distribute large positions over time.
How do I identify a Wyckoff Spring?
A Spring is a brief break below the support of a trading range that quickly reverses back into the range. Key characteristics: it occurs on relatively low volume (indicating limited genuine selling), reverses within the same session or within a few days, and is followed by a rally on increasing volume (Sign of Strength).
What is the difference between accumulation and distribution?
Accumulation occurs at market lows when institutional investors build positions by buying from fearful sellers. Distribution occurs at market highs when institutions sell their positions to eager buyers. The price and volume patterns are mirror images of each other.
Can Wyckoff be used for day trading?
Yes. Wyckoff principles apply to all timeframes. Day traders can identify intraday accumulation and distribution phases, Springs, and Upthrusts on 5-minute or 15-minute charts. The key is adapting the timeframe of analysis to your trading style.
How does Wyckoff complement other technical analysis methods?
Wyckoff provides the why behind price patterns — identifying institutional activity that drives the formations seen in chart patterns and candlestick analysis. A head and shoulders pattern, for example, can be understood through Wyckoff as a distribution phase with an UTAD (the head) and progressive Signs of Weakness.
Disclaimer
This is educational content, not financial advice. Trading involves risk, and you should consult a qualified financial advisor before making any investment decisions. Past performance does not guarantee future results.
Related Articles
12 chapters covering charts, indicators, risk management & more. Plus weekly trading insights.