Renko Charts: Noise-Free Price Action for Trend Traders
⚡ Key Takeaways
- Renko charts are a price-based charting method that forms uniform "bricks" only when price moves a specified amount, completely ignoring time and focusing purely on directional price movement.
- Each Renko brick represents a fixed price increment (the brick size), and a new brick is drawn only when price moves the full brick size above or below the previous brick.
- Renko charts excel at trend identification because they filter out minor price noise, making it easy to see the dominant trend direction at a glance.
- Reversals require price to move twice the brick size in the opposite direction (one brick to close the current move plus one brick in the new direction), providing a natural noise filter.
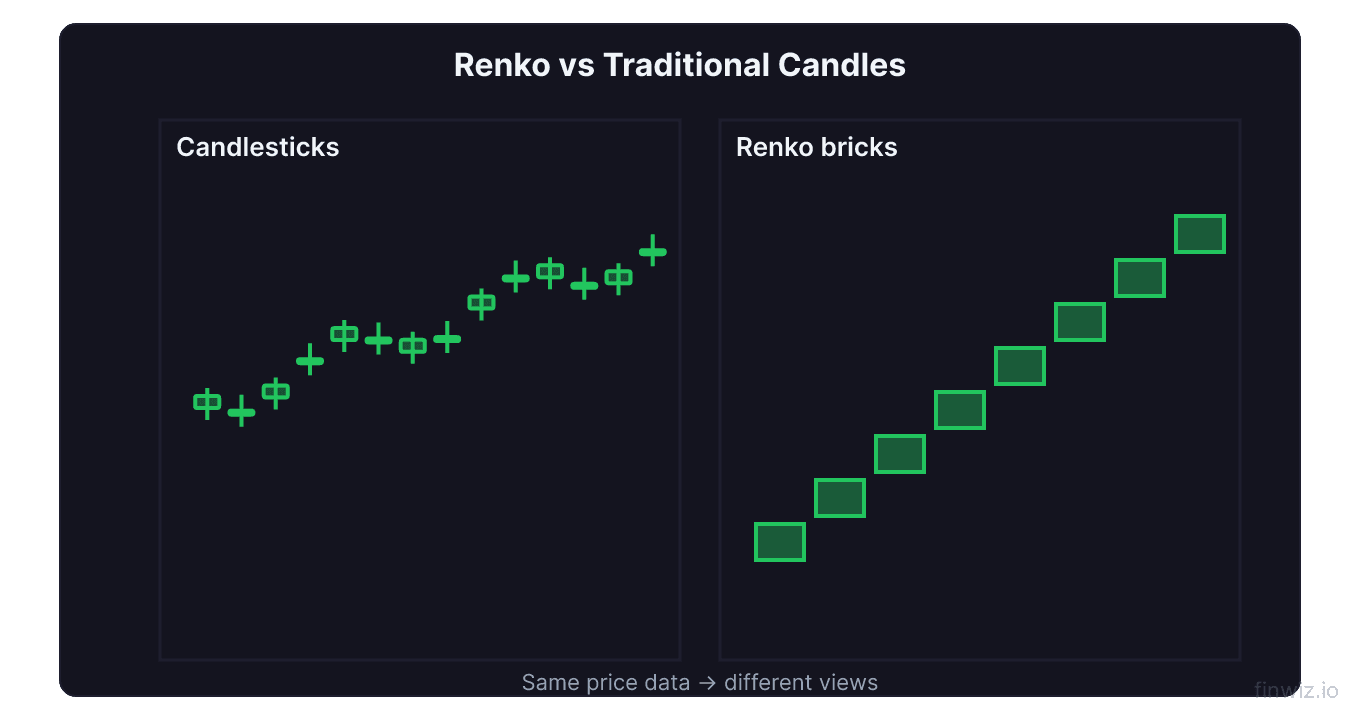
- Compared to candlestick charts, Renko charts sacrifice timing precision for clarity — they show you where price has been directionally but do not show when it got there.
What Are Renko Charts?
Renko charts are a Japanese charting technique that displays price movement using uniform bricks (or blocks) that are drawn only when price moves a predetermined amount in one direction. Unlike candlestick charts or bar charts that plot a new data point for every time period (minute, hour, day), Renko charts ignore time entirely and only care about price movement.
The word "Renko" is derived from the Japanese word "renga," meaning brick. The chart looks like a staircase of alternating colored bricks — typically green (or white) for up moves and red (or black) for down moves. Each brick is identical in height, representing the chosen brick size, and is offset diagonally from the previous brick.
If price moves sideways for three weeks without covering the brick size threshold, no new bricks are drawn — the chart simply pauses. This time-agnostic property is what gives Renko charts their greatest strength: they cut through consolidation noise and present a clean picture of directional movement.
How Renko Bricks Form
The Basic Mechanism
To understand Renko chart construction, you need to know three things: the brick size, the direction of the current move, and the close of the previous brick.
A new bullish (up) brick is drawn when price moves the full brick size above the top of the previous brick. A new bearish (down) brick is drawn when price moves the full brick size below the bottom of the previous brick.
Renko Brick Formation Rules:Why Reversals Require 2x the Brick Size
This is a critical nuance. When the chart is in an uptrend and you want a reversal (a down brick), price must move twice the brick size from the top of the last up brick. The first brick size worth of movement simply "undoes" the previous up brick's close, and the second brick size actually draws the new down brick.
This built-in 2x reversal threshold is one of the reasons Renko charts are so effective at filtering noise. Small counter-trend moves that would create whipsaws on a candlestick chart are invisible on a Renko chart.
Choosing Price Input
Most charting platforms offer two methods for determining when a new brick forms:
- Close-based: Uses only the closing price of each time period (daily close, hourly close, etc.) to determine if the brick size has been met. This produces cleaner charts but may miss intraday extremes.
- High/Low-based: Uses the high and low of each time period. This creates more bricks and faster signals but can produce some noise.
For most traders, close-based Renko charts provide the cleaner and more reliable signals.
Pro Tip
Selecting the Right Brick Size
The brick size is the single most important setting in Renko charting, and getting it right depends on the stock's price level and your trading style.
Fixed Brick Size
A fixed brick size uses a constant dollar or point value regardless of the stock's price. Common approaches:
- Percentage of price: 0.5% to 2% of the stock's current price
- ATR-based: Use the Average True Range value (typically 14-period ATR) as the brick size. This automatically adjusts for the stock's volatility.
- Dollar amount: A fixed amount like $1, $2, $5, or $10 depending on the stock's price
ATR-Based Brick Size (Recommended)
Using the 14-period ATR as your Renko brick size is the most adaptive approach. It automatically scales the brick size to the stock's current volatility:
- High-volatility stocks get larger bricks (filtering more noise)
- Low-volatility stocks get smaller bricks (maintaining sensitivity)
For a stock with a 14-day ATR of $3.50, setting the Renko brick size to $3.50 ensures that each brick represents approximately one "average day's" worth of movement.
Brick Size and Trading Style
| Trading Style | Brick Size Guideline | Effect |
|---|---|---|
| Day trading | 0.25% to 0.5% of price (or smaller ATR period) | More bricks, faster signals, more noise |
| Swing trading | 1% to 2% of price (or 14-day ATR) | Balanced signals, moderate noise filter |
| Position trading | 2% to 4% of price (or 20-day ATR) | Fewer bricks, strongest trends only |
Trend Identification with Renko
Reading the Trend
The most powerful use of Renko charts is instant trend identification. Because each brick can only be one direction (up or down), the current trend is immediately obvious:
- Uptrend: Consecutive green bricks stacking upward
- Downtrend: Consecutive red bricks stacking downward
- Trend strength: More consecutive same-colored bricks = stronger trend
A series of 8 consecutive green bricks represents sustained bullish momentum, while a single red brick in the middle of a green series signals a minor pullback that was strong enough to register as a full reversal.
Support and Resistance on Renko
Support and resistance levels are easy to identify on Renko charts. Look for horizontal price zones where:
- Price reversed multiple times (bricks changed color at the same level)
- Brick clusters formed at specific prices before breakouts
- Gaps appeared between bricks (indicating rapid movement through a level)
Because Renko charts eliminate time-based noise, the support and resistance levels they reveal tend to be cleaner and more reliable than those drawn on candlestick charts.
Renko Reversal Signals
Single Brick Reversal
The simplest reversal signal is when the chart switches from one color to another. A single red brick after a series of green bricks is a potential reversal signal. However, single-brick reversals can be premature — the trend may resume after a one-brick pullback.
Double Brick Reversal
A double brick reversal — two consecutive bricks in the new direction — is a much stronger signal. It confirms that the counter-move has momentum and is less likely to be a false signal.
Brick Count Trading Rules
Many Renko traders use simple brick-count rules:
- Enter long: After 2 consecutive green bricks following a red series
- Enter short: After 2 consecutive red bricks following a green series
- Exit: When 1 brick of the opposite color forms (tight) or 2 opposite bricks (loose)
These simple rules can form the basis of a complete trading system, particularly when combined with volume analysis or an indicator like RSI.
Pro Tip
Renko Charts vs. Candlestick Charts
Understanding what you gain and lose by switching to Renko charts helps you decide when to use each type.
What Renko Charts Do Better
- Trend clarity: Trends are unmistakable — no ambiguous mixed candles
- Noise reduction: Sideways chop and minor pullbacks are filtered out
- Support/resistance clarity: Levels are cleaner without time-based distortion
- Signal simplicity: Color changes are binary and easy to act on
- Reduced emotional trading: The clean visual removes the anxiety of choppy candlestick action
What Candlestick Charts Do Better
- Time precision: You know exactly when each candle formed
- Volume integration: Each candle corresponds to a specific time period's volume
- Gap visibility: Opening gaps are clearly visible on candlestick charts
- Pattern richness: Candlestick patterns like doji, hammer, and engulfing provide nuanced reversal signals
- Universal adoption: Virtually all traders and analysts use time-based charts
When to Use Each
| Situation | Best Chart Type |
|---|---|
| Identifying the dominant trend | Renko |
| Timing precise entries/exits | Candlestick |
| Trading range-bound markets | Candlestick |
| Following strong trends | Renko |
| Analyzing volume patterns | Candlestick |
| Reducing over-trading | Renko |
Many experienced traders use both chart types simultaneously — Renko for trend direction and candlestick for entry timing.
Advanced Renko Techniques
Renko with Moving Averages
Applying moving averages to Renko charts produces clean crossover signals. Since each "period" on a Renko chart is a brick (not a time period), a 10-period moving average on a Renko chart smooths the last 10 bricks.
Effective moving average setups for Renko:
- 10-period EMA: Fast trend signal — trade in the direction of the Renko brick when price is above (bullish) or below (bearish) the EMA
- 10/20 EMA crossover: Crossovers on Renko charts tend to be more reliable than on time-based charts because of the inherent noise filtering
Renko with Bollinger Bands
Bollinger Bands on Renko charts help identify when a trend is overextended. When bricks push outside the upper or lower band, the trend may be due for a pullback or reversal.
Multiple Brick Size Analysis
Analyze the same stock using two or three different brick sizes:
- Large brick size: Identifies the major trend direction
- Medium brick size: Shows intermediate swings within the major trend
- Small brick size: Provides entry and exit signals within the intermediate swings
This multi-brick-size approach is analogous to multi-timeframe analysis in traditional charting.
Common Renko Chart Settings by Market
Stocks ($50-$200 range)
- Swing trading: $2-$5 brick size or 14-day ATR
- Day trading: $0.50-$1.00 brick size
High-priced stocks ($500+)
- Swing trading: $10-$20 brick size or 14-day ATR
- Day trading: $3-$5 brick size
Indices (S&P 500, NASDAQ)
- Swing trading: 20-50 point brick size
- Day trading: 5-10 point brick size
Forex (EUR/USD)
- Swing trading: 20-50 pip brick size
- Day trading: 5-10 pip brick size
Limitations of Renko Charts
Lagging Nature
Renko charts are inherently lagging because a new brick only forms after the full brick-size move is complete. By the time a reversal brick appears, price has already moved the full brick size against you. This lag is the tradeoff for the noise filtering benefit.
Time Blindness
Because Renko charts ignore time, you cannot see how long a move took. A run of 5 green bricks might have formed over 2 hours or 2 months. For time-sensitive strategies, this is a significant limitation.
Backtesting Challenges
Renko charts are harder to backtest systematically because they do not correspond to fixed time intervals. Most backtesting platforms are built around time-based bars, making Renko backtesting require specialized tools.
False Signals in Choppy Markets
When price oscillates around the current brick boundary, Renko charts can produce rapid color changes (green-red-green-red) that generate false reversal signals. This typically happens during consolidation phases and is the Renko chart's equivalent of whipsaw.
FAQ
Are Renko charts good for day trading?
Yes, with the right brick size. Use a smaller brick size (roughly 0.25-0.5% of the stock's price) for day trading. Renko charts help day traders avoid overtrading during choppy periods because no new bricks form when price is range-bound. However, you should use a time-based chart alongside Renko for precise entry timing.
What is the best brick size for Renko charts?
There is no single best brick size — it depends on the stock's price, volatility, and your trading timeframe. The 14-period ATR is the most widely recommended starting point because it automatically adapts to the current volatility. Adjust from there based on whether you want more signals (smaller bricks) or cleaner trends (larger bricks).
Can I use Renko charts for cryptocurrency trading?
Yes. Renko charts work well for cryptocurrencies because crypto markets are particularly noisy and volatile. The noise-filtering properties of Renko charts can help crypto traders identify genuine trends amid the high volatility. Use ATR-based brick sizing to account for crypto's wide price swings.
Do Renko charts work with technical indicators?
Yes. Most indicators — including RSI, MACD, Bollinger Bands, and moving averages — can be applied to Renko charts. However, remember that each "period" on a Renko chart is a brick, not a time period, so indicator parameters may need adjustment. A 14-period RSI on a Renko chart measures the last 14 bricks, which could represent days or weeks of actual time.
Which platforms support Renko charts?
Most professional charting platforms support Renko charts, including TradingView, thinkorswim (TD Ameritrade), MetaTrader, NinjaTrader, and TradeStation. TradingView is particularly popular for Renko charting because of its intuitive brick size settings and ability to overlay indicators.
Disclaimer
This is educational content, not financial advice. Trading involves risk, and you should consult a qualified financial advisor before making any investment decisions. Past performance does not guarantee future results.
Related Articles
12 chapters covering charts, indicators, risk management & more. Plus weekly trading insights.