Hammer Candlestick: Bullish Reversal Signal Explained
⚡ Key Takeaways
- The hammer candlestick is a bullish reversal pattern that forms at the bottom of a downtrend, featuring a small body and a long lower wick at least twice the body
- s color (green or red) is secondary to its shape and context; however, a green (bullish close) hammer is considered slightly more reliable.
- Confirmation from the next candle is essential: a strong bullish close following the hammer validates the reversal signal.
- The inverted hammer is a related pattern with a long upper wick that can also signal bullish reversals at the bottom of downtrends.
What Is a Hammer Candlestick?
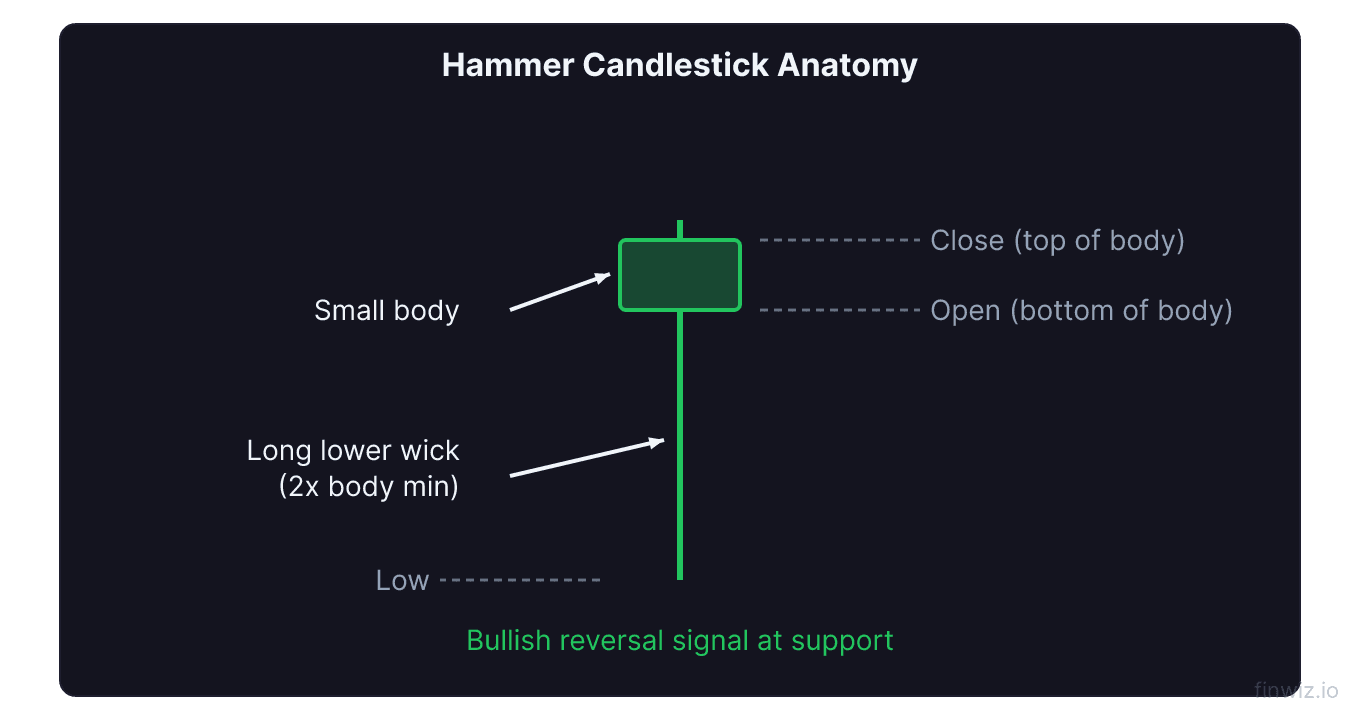
The hammer candlestick is a single-candle bullish reversal pattern that appears at the end of a downtrend. It is one of the most widely recognized and frequently traded candlestick patterns in technical analysis.
The hammer gets its name from its distinctive shape: a small real body at the upper end of the trading range with a long lower shadow (wick) that extends at least twice the length of the body. The result looks like a hammer with a handle pointing downward.
This pattern tells a compelling story about the battle between buyers and sellers. During the session, bears initially dominated and drove prices sharply lower. But at some point during the session, bulls stepped in aggressively, absorbing the selling pressure and pushing the price back up to close near the open. The long lower shadow represents the territory that sellers claimed but could not hold.
Anatomy of the Hammer
Understanding the precise structure of the hammer helps you distinguish it from similar candles.
Body
The real body should be small, positioned at or near the top of the candle's trading range. The body can be either bullish (green/white, close above open) or bearish (red/black, close below open). A bullish body is slightly preferred because it shows buyers actually managed to push the close above the open, but both colors are valid hammers.
Lower Shadow
The lower shadow (lower wick) is the defining feature of the hammer. It must be at least twice the length of the real body, though the most powerful hammers have shadows three to four times the body length. This long shadow demonstrates the extent of the selling attempt and the strength of the buyer recovery.
Upper Shadow
Ideally, the hammer has little to no upper shadow. A small upper shadow is acceptable, but a long upper shadow transforms the candle into a different pattern (potentially a spinning top or long-legged doji). The absence of an upper shadow confirms that the close was near the session high, reinforcing the bullish recovery narrative.
Pro Tip
Conditions for a Valid Hammer
Not every candle with a long lower wick qualifies as a tradeable hammer. Several conditions must be met.
Downtrend context. The hammer must appear during a downtrend or at least after a meaningful decline. A hammer-shaped candle in an uptrend is classified as a hanging man and carries bearish rather than bullish implications. The same shape has opposite meanings depending on the trend context.
Key level proximity. The most reliable hammers form at significant support levels, prior swing lows, Fibonacci retracement levels, or major moving averages. The confluence of a hammer pattern with a known support level dramatically increases the probability of a successful reversal.
Sufficient decline. The hammer should appear after a meaningful decline, not after a single red candle in an otherwise uptrending market. The deeper and more extended the prior decline, the more significant the hammer signal becomes.
Trading the Hammer Candlestick
The hammer provides a clear framework for planning entries, stops, and targets.
Waiting for Confirmation
The most important rule when trading hammers is to wait for confirmation. The candle immediately following the hammer should close bullish, preferably closing above the hammer's real body. This confirmation candle proves that the buying interest signaled by the hammer has followed through.
Without confirmation, the hammer remains just a single-session anomaly. The market could still continue lower despite the intra-session recovery. Professional traders almost always require confirmation before entering a position based on a hammer.
Entry Strategies
Standard entry: Buy on the close of the confirmation candle (the bullish candle following the hammer) or at the open of the next session. This approach sacrifices some of the potential gain but significantly reduces false signal risk.
Aggressive entry: Buy at the close of the hammer session itself, before confirmation. This captures more of the move but carries higher risk. Only use this approach when additional factors (strong support level, oversold RSI, high volume) strongly support the reversal thesis.
Above-the-high entry: Buy when price breaks above the high of the hammer candle during the following session. This provides additional confirmation that buyers are willing to push above the hammer's maximum price.
Stop Loss Placement
The stop loss goes below the low of the hammer (the bottom of the lower shadow). This level represents the point of maximum selling pressure during the hammer session. If price breaks below this level, the hammer has failed and the downtrend is likely to continue.
For tighter risk management, some traders place the stop slightly below the hammer's low (a few cents or pips) to account for minor whipsaws while still maintaining pattern protection.
Profit Targets
Several methods exist for setting profit targets on hammer trades:
- Previous resistance: The nearest overhead resistance level from the prior decline
- Fibonacci extension: Use Fibonacci extensions from the hammer low to project potential targets
- Measured move: Measure the depth of the prior decline and project a similar distance from the hammer low as the target
- Moving average target: The declining 20-day or 50-day moving average can serve as an initial target
| Component | Specification |
|---|---|
| Body Position | Top of candle range |
| Lower Wick | Minimum 2x body length |
| Upper Wick | Minimal or absent |
| Body Color | Green preferred, red acceptable |
| Context | Bottom of downtrend |
| Confirmation | Bullish close next session |
| Stop Loss | Below hammer low |
Hammer vs. Related Patterns
Several candlestick patterns look similar to the hammer but carry different implications.
Hammer vs. Hanging Man
The hanging man is structurally identical to the hammer: small body at the top, long lower shadow, minimal upper shadow. The only difference is context. The hammer appears in a downtrend (bullish reversal), while the hanging man appears in an uptrend (bearish warning).
The hanging man suggests that despite closing near the highs, the long intra-session decline is an early sign of seller activity in what has been a buyer-dominated market. It is generally considered less reliable than the hammer and requires stronger confirmation.
Hammer vs. Dragonfly Doji
The dragonfly doji is similar to the hammer but has virtually no real body (the open and close are nearly identical). The doji represents a more complete state of indecision than the hammer. In practice, both patterns signal the same thing at the bottom of a downtrend: strong rejection of lower prices. The hammer, with its small but visible body, shows slightly more bullish conviction.
Hammer vs. Inverted Hammer
The inverted hammer has the opposite wick orientation: a small body at the bottom of the range with a long upper shadow and minimal lower shadow. Despite looking like a bearish formation, the inverted hammer is also a bullish reversal signal when it appears in a downtrend.
The inverted hammer works because the long upper shadow shows that buyers attempted to push prices higher during the session. While they could not hold those gains, the attempt itself signals that buying interest is returning. Confirmation on the following session is especially important for the inverted hammer because the candle itself closes near the lows.
Pro Tip
Volume Analysis with Hammers
Volume adds critical context to hammer analysis.
High volume on the hammer is the strongest confirmation. It shows that the intra-session battle between buyers and sellers involved significant participation. The recovery from the lows on heavy volume means that large market participants (institutions, funds) stepped in to buy, which carries more weight than a recovery on thin volume.
Low volume on the hammer weakens the signal. A recovery from the lows on thin volume might simply reflect a lack of selling interest rather than genuine buying demand. The difference matters because active buying creates sustainable reversals, while passive price recovery often leads to continued declines.
Volume on the confirmation candle should ideally be above average, showing that the buying interest demonstrated by the hammer is continuing. If the confirmation candle has strong volume, the reversal is more likely to produce a meaningful advance.
Hammer Candlestick Across Markets
The hammer pattern appears in all financial markets but may behave differently across them.
In stocks, hammers are particularly effective when they form at well-known support levels, round numbers, or major moving averages. Earnings-related hammers can be powerful when a stock gaps down on earnings but recovers throughout the session, forming a hammer that signals buyer absorption of the initial selling pressure.
In forex, hammers are common on the daily and 4-hour charts. They work well at key psychological levels (major round numbers) and at levels where central bank policy creates implicit support or resistance. Because forex has no gaps (except weekends), the clean price action often produces well-defined hammers.
In cryptocurrency, hammers can signal significant reversals but require wider stops due to the higher volatility. Crypto hammers at major support levels during periods of extreme fear (as measured by sentiment indicators) can produce exceptional buying opportunities.
Combining Hammers with Other Analysis
The hammer is most effective when it aligns with additional technical and fundamental factors.
RSI oversold readings. When the RSI is below 30 and a hammer forms, the combination of an oversold momentum indicator and a bullish reversal candle creates strong confluence. This dual signal significantly improves the probability of a successful reversal.
Moving average support. A hammer that forms precisely at the 50-day or 200-day moving average benefits from the dynamic support provided by these widely watched levels. Many institutional traders use moving averages as buying zones, so a hammer at a major moving average can trigger significant institutional demand.
Fibonacci retracement levels. If the preceding decline has retraced to a key Fibonacci level (38.2%, 50%, or 61.8%) and a hammer forms at that level, the Fibonacci support adds another layer of significance to the reversal signal.
Bullish divergence. If the RSI or MACD is making a higher low while price makes a lower low during the hammer session, this divergence adds powerful confirmation that downward momentum is exhausting.
Common Mistakes When Trading Hammers
Avoid these frequent errors to improve your results with hammer trades.
Ignoring the trend. A hammer-shaped candle in a sideways market or mild uptrend is not a valid hammer signal. The pattern requires a preceding downtrend to have reversal implications.
Skipping confirmation. Entering immediately upon seeing a hammer, without waiting for the next candle's confirmation, leads to trading many false signals. Patience is essential.
Setting stops too tight. Placing the stop just below the hammer's close rather than below its low reduces the protection the pattern offers. The stop belongs below the hammer's low, which is the point where the reversal thesis is invalidated.
Ignoring volume. A hammer on extremely low volume may be a false signal. Always check that the hammer formed with reasonable participation, and that the confirmation candle shows supporting volume.
Frequently Asked Questions
Does the color of the hammer candle matter?
The color of the hammer body provides a slight edge but is not the primary factor. A green (bullish) hammer, where the close is above the open, is considered marginally more reliable because buyers managed to push the close above the opening price, showing a small victory for the bulls. A red (bearish) hammer, where the close is slightly below the open, is still a valid reversal signal as long as the long lower shadow and overall shape meet the criteria. The key is the lower shadow length and the trend context, not the body color.
What is the difference between a hammer and a pin bar?
The terms hammer and pin bar refer to essentially the same candlestick formation, but they come from different trading traditions. "Hammer" is the traditional Japanese candlestick terminology, while "pin bar" (short for Pinocchio bar) is the term used in price action trading circles. Both describe a candle with a small body and a long wick that shows price rejection. Some price action traders use slightly different criteria for pin bars, such as requiring the wick to be at least three times the body length rather than the standard two times for a hammer.
How reliable is the hammer candlestick as a reversal signal?
Studies suggest that the hammer candlestick, when properly confirmed by a bullish follow-through candle, has a reliability rate of approximately 55-65%. This rate improves significantly when the hammer appears at a major support level, when volume is above average, and when momentum indicators show oversold conditions or bullish divergence. The hammer should not be used as a standalone signal; it works best as part of a broader analysis framework that includes multiple confirmation factors. Even with strong confluence, use a stop loss to protect against the inevitable failures.
Can a hammer candlestick appear on any timeframe?
Yes, hammers appear on all timeframes from 1-minute charts to monthly charts. However, the reliability and significance increase with the timeframe. A hammer on a daily chart reflects a full day's worth of price action and carries much more weight than one on a 5-minute chart. For swing trading and investing, focus on daily and weekly hammers. For day trading, 15-minute and 1-hour hammers at key intraday levels can provide useful signals, but they should be treated with more caution and combined with intraday volume analysis.
Disclaimer
This is educational content, not financial advice. Trading involves risk, and you should consult a qualified financial advisor before making any investment decisions. Past performance does not guarantee future results.
12 chapters covering charts, indicators, risk management & more. Plus weekly trading insights.