Doji Candlestick: What It Means & How to Trade It
⚡ Key Takeaways
- A doji candlestick forms when the open and close prices are virtually identical, creating a cross or plus-sign shape on the chart.
- Doji candles signal market indecision and are most significant when they appear after a strong trend move, potentially foreshadowing a reversal.
- There are four main doji types: standard doji, long-legged doji, dragonfly doji, and gravestone doji, each with unique implications.
- A doji alone is not a trading signal; it requires confirmation from the following candle and additional context such as support, resistance, and volume.
- Doji candles work best on daily and weekly timeframes, where they reflect broader market sentiment shifts.
What Is a Doji Candlestick?
A doji candlestick forms when a security's open and close prices are virtually identical during a trading session. The result is a candle with a very small or nonexistent real body, often appearing as a thin horizontal line. The wicks (shadows) can vary in length, extending above and below the body to show the session's high and low.
The doji is one of the most important single-candle patterns in candlestick analysis because it represents a state of equilibrium between buyers and sellers. During the session, both sides fought for control, but neither gained a decisive advantage by the close. The price ended essentially where it started.
The word "doji" comes from the Japanese word meaning "the same thing," referring to the rarity of the open and close being at the exact same level. In practice, most charting platforms recognize a doji when the body is within a very small percentage of the overall candle range, even if the open and close are not mathematically identical.
Why Doji Candles Matter
By itself, a doji is a neutral pattern. It simply says that neither buyers nor sellers won the session. However, context transforms the doji from a simple observation into a powerful signal.
After a strong uptrend, a doji suggests that bullish momentum is stalling. If the bulls were firmly in control, the session would have closed well above the open. The doji shows that sellers are beginning to match buyer strength, potentially foreshadowing a bearish reversal.
After a strong downtrend, a doji signals that selling pressure may be exhausting. If sellers were in complete control, the close would be well below the open. The doji indicates that buyers are stepping in with enough force to neutralize the selling, potentially setting up a bullish reversal.
In a sideways market, dojis are common and carry less significance. When price is already chopping back and forth without direction, indecision candles are expected and do not provide meaningful trading signals.
Pro Tip
Types of Doji Candles
While all dojis share the characteristic of a near-identical open and close, the length and position of the wicks create four distinct variations, each with its own implications.
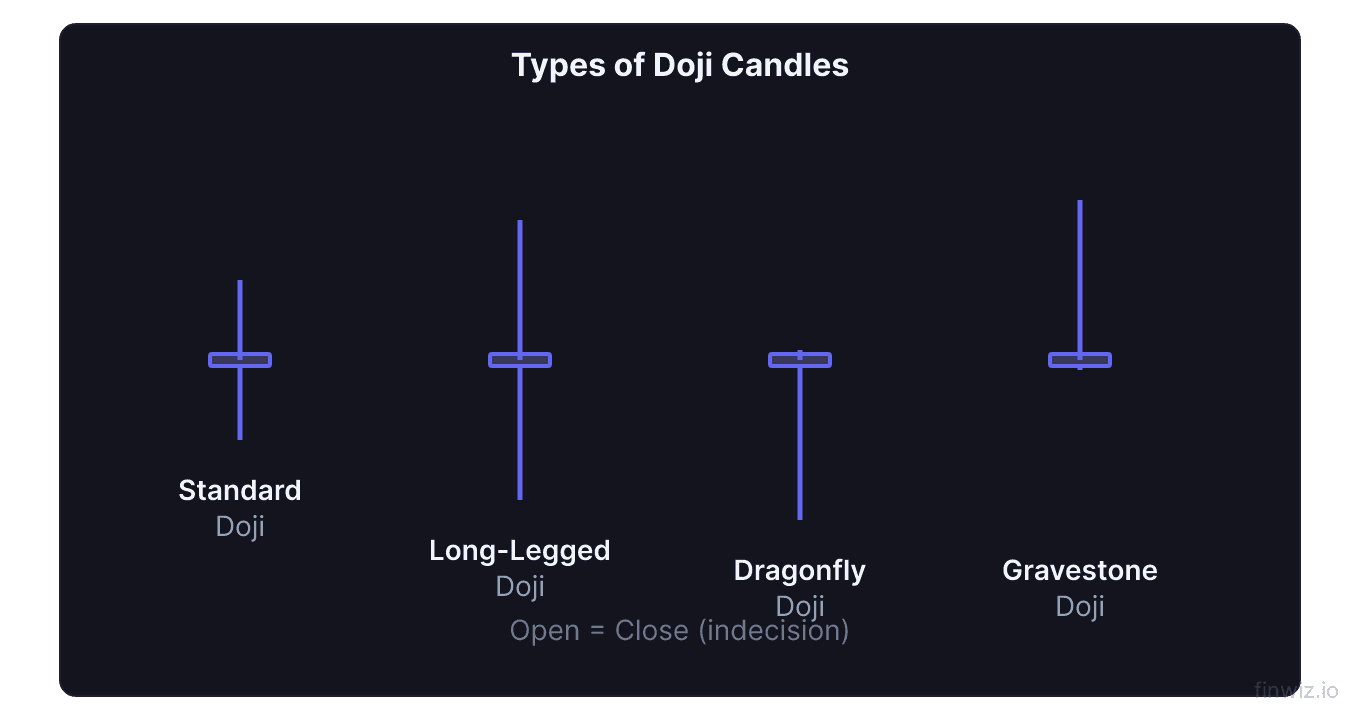
Standard Doji
The standard doji (also called the neutral doji or common doji) has small, roughly equal upper and lower wicks with the cross positioned near the middle of the range. It represents pure indecision with neither buyers nor sellers showing any particular dominance during the session. The standard doji is most significant at support and resistance levels.
Long-Legged Doji
The long-legged doji has exceptionally long upper and lower wicks, showing that prices swung dramatically in both directions during the session before settling back at the open. This pattern indicates extreme volatility and uncertainty. Both buyers and sellers pushed aggressively, but neither could maintain their gains.
Long-legged dojis are particularly meaningful at market turning points because they show genuine conflict between bulls and bears. The extreme wicks represent real participation, making the indecision signal stronger than that of a standard doji.
Dragonfly Doji
The dragonfly doji has the open and close at or near the session high, with a long lower shadow and little or no upper shadow. It resembles a capital "T" on the chart.
The dragonfly doji is most significant at the end of a downtrend. The long lower shadow shows that sellers pushed prices significantly lower during the session, but buyers rallied the price all the way back to the open by the close. This strong recovery suggests that demand is returning and a bullish reversal may follow.
When the dragonfly doji appears at the bottom of a downtrend, it functions similarly to a hammer candlestick, with the caveat that the hammer has a small body while the dragonfly has virtually no body.
Gravestone Doji
The gravestone doji has the open and close at or near the session low, with a long upper shadow and little or no lower shadow. It resembles an inverted "T" or tombstone shape.
The gravestone doji is most significant at the end of an uptrend. The long upper shadow shows that buyers pushed prices significantly higher during the session, but sellers drove the price all the way back to the open by the close. This complete rejection of higher prices suggests that supply is overwhelming demand and a bearish reversal may follow.
At the top of an uptrend, the gravestone doji functions similarly to a shooting star, though the shooting star has a small body while the gravestone has virtually no body.
| Doji Type | Shape | Location | Signal |
|---|---|---|---|
| Standard | Small cross in middle | Any key level | Pure indecision |
| Long-Legged | Long wicks both sides | Turning points | Extreme volatility |
| Dragonfly | T-shape (long lower wick) | Bottom of downtrend | Bullish reversal |
| Gravestone | Inverted T (long upper wick) | Top of uptrend | Bearish reversal |
How to Trade Doji Candles
A doji should never be traded in isolation. It is a warning signal, not a directional trigger. The candle that follows the doji determines the trading action.
Bullish Doji Setup
When a doji appears after a downtrend at a support level, wait for the next candle to close bullish (above the doji's high). This confirmation candle validates the reversal signal. Enter long on the close of the confirmation candle or the open of the following session.
Stop loss: Place the stop below the low of the doji (or below the support level, whichever is lower). The doji's low represents the extreme point of selling pressure.
Target: Use the nearest resistance level or a measured move based on the depth of the preceding decline.
Bearish Doji Setup
When a doji appears after an uptrend at a resistance level, wait for the next candle to close bearish (below the doji's low). This confirmation establishes that sellers have taken control.
Stop loss: Place the stop above the high of the doji or above the resistance level.
Target: Use the nearest support level or a measured move based on the height of the preceding advance.
Pro Tip
Doji in Multi-Candle Patterns
Doji candles frequently appear as components of larger multi-candle patterns, where they play a crucial role.
Doji Star Patterns
The doji can serve as the "star" in both the morning star (bullish) and evening star (bearish) patterns. In the morning star, the doji appears between a long bearish candle and a long bullish candle, marking the precise moment when bearish momentum shifted to bullish. In the evening star, the doji sits between a long bullish candle and a long bearish candle.
When the star in these three-candle patterns is specifically a doji, the formation is called a morning doji star or evening doji star. These are considered more significant than the standard morning/evening star because the doji represents a more complete state of indecision at the turning point.
Abandoned Baby
The abandoned baby is a rare and powerful pattern where a doji gaps away from both the preceding and following candles. In a bullish abandoned baby, a gap-down doji follows a bearish candle, and then a bullish candle gaps up from the doji. The doji is "abandoned" in the gap space. This pattern is extremely rare but highly reliable when it appears.
Doji Across Different Timeframes
The timeframe on which a doji appears significantly affects its importance.
Daily charts are the most commonly used timeframe for doji analysis. A daily doji represents a full day of price action where the market could not decide on a direction. Multiple daily dojis in succession (called a doji cluster) amplify the indecision signal and often precede significant moves in either direction.
Weekly charts produce less frequent but more powerful doji signals. A weekly doji means that an entire week of trading resulted in no net progress. When this occurs after a multi-week trend, the reversal implications are substantial.
Intraday charts (5-minute, 15-minute) produce dojis very frequently, and most of them are meaningless noise. Intraday dojis should only be traded when they appear at very specific levels (major support/resistance, VWAP, or key moving averages) and when the intraday trend has been strong in one direction.
Volume and the Doji
Volume adds an important dimension to doji analysis.
A doji that forms on high volume is more significant than one on low volume because it shows that many participants were actively trading but could not move the price. High-volume dojis indicate genuine conflict between large buyers and large sellers.
A doji on low volume may simply reflect a lack of interest or participation (such as a holiday-shortened session) rather than true indecision. These low-volume dojis carry little analytical weight.
Volume on the confirmation candle is equally important. If a bullish confirmation candle follows a doji on high volume, the reversal signal is strong. If the confirmation candle has weak volume, the signal is suspect.
Common Mistakes with Doji Trading
Understanding frequent errors helps you avoid them.
Trading every doji. Dojis appear frequently on all charts. Most of them are noise, not signals. Only trade dojis that appear in meaningful contexts: after strong trends, at significant support or resistance levels, or as part of multi-candle patterns.
Not waiting for confirmation. The most common mistake is entering a trade immediately when a doji forms, without waiting for the next candle to confirm direction. The doji says the market is undecided; you need the following candle to tell you which side won.
Ignoring the trend. A doji in the middle of a range-bound market tells you nothing useful. Dojis gain their predictive power from the trend that precedes them. Without a clear trend for the doji to potentially reverse, the pattern lacks context.
Using dojis on too-low timeframes. On 1-minute and 5-minute charts, dojis form constantly as part of normal price fluctuation. They are only useful on these timeframes when combined with very specific confluence factors. For reliable signals, focus on the daily timeframe and above.
Doji Patterns in Different Markets
The doji appears across all markets but carries different weights.
In stocks, dojis are particularly meaningful because the defined open and close create genuine data points. Dojis on individual stocks can be influenced by company-specific news, earnings, or analyst actions. Focus on dojis that form on the stock's own merits rather than on reaction to external events.
In forex, dojis are common on all timeframes. They are most meaningful on the daily chart at key psychological levels (round numbers), historical support and resistance, and Fibonacci levels. Because forex trades 24 hours, session-specific dojis (such as those forming at the New York close) carry more weight.
In cryptocurrency, the 24/7 trading environment produces frequent dojis. The extreme volatility of crypto means that even long-legged dojis may be relatively common. Use wider context and stronger confirmation requirements for crypto doji trades.
Frequently Asked Questions
Is a doji bullish or bearish?
A doji is inherently neutral. It represents indecision, not a directional signal. Its bullish or bearish implications depend entirely on context. A doji after a strong uptrend at resistance has bearish implications because it suggests buyers are losing control. A doji after a strong downtrend at support has bullish implications because it suggests sellers are losing power. Without trend and level context, a doji tells you nothing about future direction. Always wait for a confirmation candle before assigning a directional bias.
How rare is a doji candlestick?
Doji candles are actually quite common, especially on lower timeframes. On a daily chart, you might see a doji several times per month for any actively traded security. However, meaningful dojis (those that appear after strong trends at key levels) are far less frequent. The rarity is not in the doji itself but in the context that makes it significant. Focus on quality over quantity by only acting on dojis that have strong contextual support.
What is the most powerful doji pattern?
The evening doji star and morning doji star are generally considered the most powerful doji-based patterns because they combine the doji's indecision with the directional confirmation of the preceding and following candles. The abandoned baby pattern (a gapped doji between two directional candles) is statistically the most reliable but also the rarest. Among individual dojis, the dragonfly doji at support and the gravestone doji at resistance are the most actionable single-candle doji signals.
Can I use doji candles for day trading?
Yes, but with important caveats. Dojis on intraday charts are extremely common and most are not significant. For day trading, only act on dojis that form at major intraday levels such as the previous day's high or low, the VWAP, or significant support and resistance zones. Combine the doji with volume analysis and momentum indicators to filter out noise. Many day traders find that doji signals on the 15-minute or 30-minute chart, confirmed by the next candle, provide the best balance of signal quality and trading frequency.
Disclaimer
This is educational content, not financial advice. Trading involves risk, and you should consult a qualified financial advisor before making any investment decisions. Past performance does not guarantee future results.
Related Articles
12 chapters covering charts, indicators, risk management & more. Plus weekly trading insights.