Spinning Top Candlestick: Indecision in the Market
⚡ Key Takeaways
- The spinning top is a candlestick pattern with a small real body and long upper and lower shadows, signaling market indecision where neither buyers nor sellers have clear control.
- The small body shows that the open and close are near each other despite significant intra-session price movement in both directions.
- Context determines meaning: a spinning top after a strong trend signals potential reversal, while a spinning top in a range signals continued indecision.
- The spinning top differs from a doji primarily in that it has a visible (though small) real body, while the doji has virtually no body.
- Spinning tops are warning signals rather than actionable trade triggers — they require confirmation from subsequent price action before taking a position.
What Is a Spinning Top Candle?
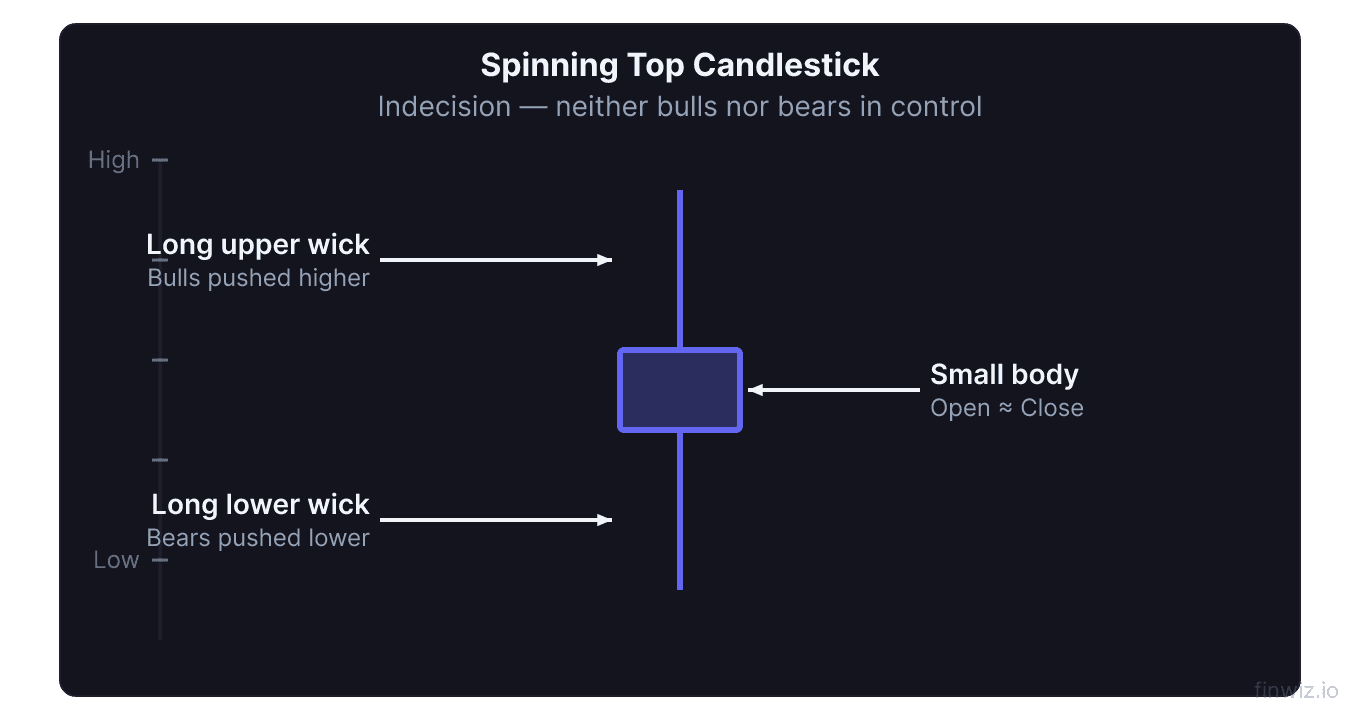
The spinning top is a single-candle pattern characterized by a small real body positioned between relatively long upper and lower shadows. It is one of the most common candlestick formations and represents a session where both buyers and sellers were active but neither side achieved dominance.
During a spinning top session, prices moved significantly in both directions. Bulls pushed the price higher (creating the upper shadow), and bears drove it lower (creating the lower shadow). But by the close, the price settled near the open, producing a small real body. The result is a candle that looks like a child's spinning top toy.
The spinning top is fundamentally a neutral pattern. It does not inherently predict direction. Instead, it signals that the market is at a crossroads. The prior trend's momentum has stalled, and the next session's action will determine whether the trend resumes or reverses.
Anatomy of the Spinning Top
Understanding the structural requirements helps you correctly identify spinning tops on your charts.
Small Real Body
The real body is the defining feature. It must be small relative to the candle's total range — typically less than one-third of the distance from the high to the low. The body can be either bullish (green, close above open) or bearish (red, close below open). The color has minimal significance because the body is so small that the difference between open and close is negligible.
Upper Shadow
The upper shadow extends from the top of the body to the session high. It should be noticeably longer than the body, showing that buyers pushed prices significantly higher during the session before sellers rejected the advance.
Lower Shadow
The lower shadow extends from the bottom of the body to the session low. Like the upper shadow, it should be significantly longer than the body, showing that sellers pushed prices lower before buyers rejected the decline.
Proportions
The most textbook spinning tops have roughly symmetrical shadows — the upper and lower shadows are approximately equal in length. However, some asymmetry is acceptable. If one shadow is dramatically longer than the other, the candle may be better classified as a hammer, hanging man, or shooting star.
Pro Tip
Spinning Top vs. Doji: Key Differences
The spinning top and doji are closely related patterns that both signal indecision, but they have distinct structural differences.
| Feature | Spinning Top | Doji |
|---|---|---|
| Real body | Small but visible | Virtually nonexistent (open equals close) |
| Indecision level | High | Extreme |
| Signal strength | Moderate | Stronger |
| Frequency | Very common | Less common |
| Shadow requirement | Long upper and lower | Varies by doji type |
The doji represents a more extreme form of indecision because the open and close are at exactly (or virtually) the same price. The spinning top shows a slight lean toward one side (the small body) but not enough to establish directional conviction.
In practice, many traders group spinning tops and dojis together as indecision candles and analyze them similarly. The key question for both is the same: what happens next?
Spinning Top After an Uptrend
When a spinning top appears after a sustained uptrend, it carries potentially bearish implications. The logic is straightforward: throughout the uptrend, bulls have been producing large-bodied bullish candles with strong closes. The sudden appearance of a spinning top shows that the buying momentum has stalled.
The spinning top in this context tells you that:
- Sellers have become active enough to match buyer pressure
- The one-sided buying conviction that drove the uptrend has evaporated
- A potential distribution phase or reversal may be developing
However, the spinning top alone does not confirm a reversal. It is a yellow light, not a red light. If the next candle is a strong bearish candle that closes below the spinning top's low, the reversal gains credibility. If the next candle is a strong bullish candle, the uptrend is likely to continue.
Spinning Top After a Downtrend
A spinning top after a downtrend carries potentially bullish implications. After sessions of persistent selling, the spinning top shows that bears can no longer drive prices lower with conviction.
This context suggests that:
- Buyers are stepping in with enough force to contest the decline
- Selling momentum is fading
- A potential accumulation phase or reversal may be forming
Again, confirmation is essential. A strong bullish candle following the spinning top confirms a potential reversal. A continued decline negates the signal.
Pro Tip
Spinning Top in a Trading Range
When spinning tops appear in the middle of a trading range, they carry minimal directional significance. Markets spend considerable time in consolidation, and indecision candles within a range simply confirm that the range-bound behavior continues.
Do not overanalyze spinning tops within ranges. They become meaningful only when they appear at the edges of the range — near support or resistance — where they might signal that the boundary will hold and price will reverse back into the range.
Trading with Spinning Tops
As a Reversal Warning
The most common use of the spinning top is as an early warning signal for traders already in positions.
For long positions: A spinning top after a rally suggests tightening your stop loss, reducing position size, or preparing to exit if the next candle is bearish. It does not mean exit immediately, but it means stop adding to the position and increase your vigilance.
For short positions: A spinning top after a decline suggests similar caution. Tighten your stop or reduce size rather than adding to the short.
As a Confirmation Tool
The spinning top also serves as a confirmation tool within other patterns. For instance, a spinning top appearing as the second candle in a harami pattern strengthens the indecision signal. A spinning top at the top of a pattern like a head and shoulders adds credibility to the reversal thesis.
Entry After Spinning Top Breakout
Some traders use the spinning top's high and low as breakout triggers:
- Buy signal: Price breaks above the spinning top's high on the next candle with conviction (long body, strong close, above-average volume)
- Sell signal: Price breaks below the spinning top's low on the next candle with conviction
This approach lets the market resolve the indecision before committing capital. The spinning top's range becomes a decision zone, and the breakout direction dictates the trade.
Volume Considerations
Volume during a spinning top session provides important context.
High volume spinning top. A spinning top with above-average volume is a more significant warning signal. It shows that many traders participated in the session's tug-of-war, resulting in a genuine standoff. This often occurs at key turning points where institutional traders are transitioning positions.
Low volume spinning top. A spinning top on low volume is less meaningful. The indecision may simply reflect thin trading rather than a genuine battle between buyers and sellers. Low-volume spinning tops in quiet markets (like holiday sessions) should be largely ignored.
Compare volume to the 20-day average and use indicators like OBV or the Money Flow Index for additional volume context.
Combining Spinning Tops with Indicators
RSI extremes. A spinning top becomes more significant when the RSI is at overbought (above 70) or oversold (below 30) levels. The combination of a momentum extreme with visible indecision increases the reversal probability.
Bollinger Band contact. Spinning tops at the upper or lower Bollinger Band carry extra weight because they combine statistical extreme levels with indecision.
Moving average interaction. A spinning top right at a key moving average (50-day or 200-day) often precedes a significant resolution as the market decides whether to respect or violate the moving average support/resistance.
MACD divergence. If MACD shows divergence from price at the time a spinning top appears, the case for reversal strengthens considerably.
Common Mistakes
Over-trading spinning tops. Because they are so common, traders who act on every spinning top will generate excessive trades with a low win rate. Be selective — only trade spinning tops at significant levels with strong confluence.
Ignoring context. A spinning top in the middle of a range is meaningless. A spinning top after an extended trend at a key level is significant. Context is everything.
Trading without confirmation. The spinning top itself is not a trade signal. It is a warning that requires confirmation from subsequent price action. Wait for the market to commit to a direction before entering.
Confusing with other patterns. Ensure the candle meets the spinning top criteria: small body with long shadows on both sides. A candle with a small body and only one long shadow is likely a hammer, hanging man, or shooting star, each with different implications.
Frequently Asked Questions
Is the spinning top bullish or bearish?
The spinning top is neither inherently bullish nor bearish. It is a neutral indecision pattern. Its directional implication depends entirely on context — where it appears relative to the prior trend and what happens on the following candle. After an uptrend, it may warn of a bearish reversal. After a downtrend, it may signal a bullish reversal.
How often do spinning tops appear on charts?
Spinning tops are among the most frequent candlestick patterns. On daily charts of actively traded securities, you will see spinning tops multiple times per month. Their frequency is one reason they should not be traded in isolation — selectivity and context are essential.
What is the difference between a spinning top and a long-legged doji?
The long-legged doji has no visible real body (open equals close), while the spinning top has a small but visible body. Both have long upper and lower shadows and signal indecision, but the doji represents a more extreme version. In practice, candles on the borderline between these classifications carry similar implications.
Can spinning tops signal continuation?
Yes. A spinning top within a strong trend sometimes represents a brief pause before the trend resumes. If the spinning top forms on low volume and the next candle continues in the trend direction, the indecision was temporary. This is especially common in strong trending markets where pullbacks are shallow.
Should I exit my position when I see a spinning top?
Not necessarily. A spinning top is a warning signal, not an exit signal. It suggests monitoring the position more closely, tightening stop losses, or reducing size. Only exit if the candle following the spinning top confirms a reversal against your position.
What timeframe works best for spinning top analysis?
The daily chart is most commonly used for spinning top analysis. Higher timeframes (weekly, monthly) produce less frequent but more significant spinning top signals. Intraday spinning tops are extremely common and should generally be ignored unless they form at critical support/resistance levels with volume confirmation.
Disclaimer
This is educational content, not financial advice. Trading involves risk, and you should consult a qualified financial advisor before making any investment decisions. Past performance does not guarantee future results.
Related Articles
12 chapters covering charts, indicators, risk management & more. Plus weekly trading insights.