Island Reversal: The Gap Pattern That Signals a Trend Change
⚡ Key Takeaways
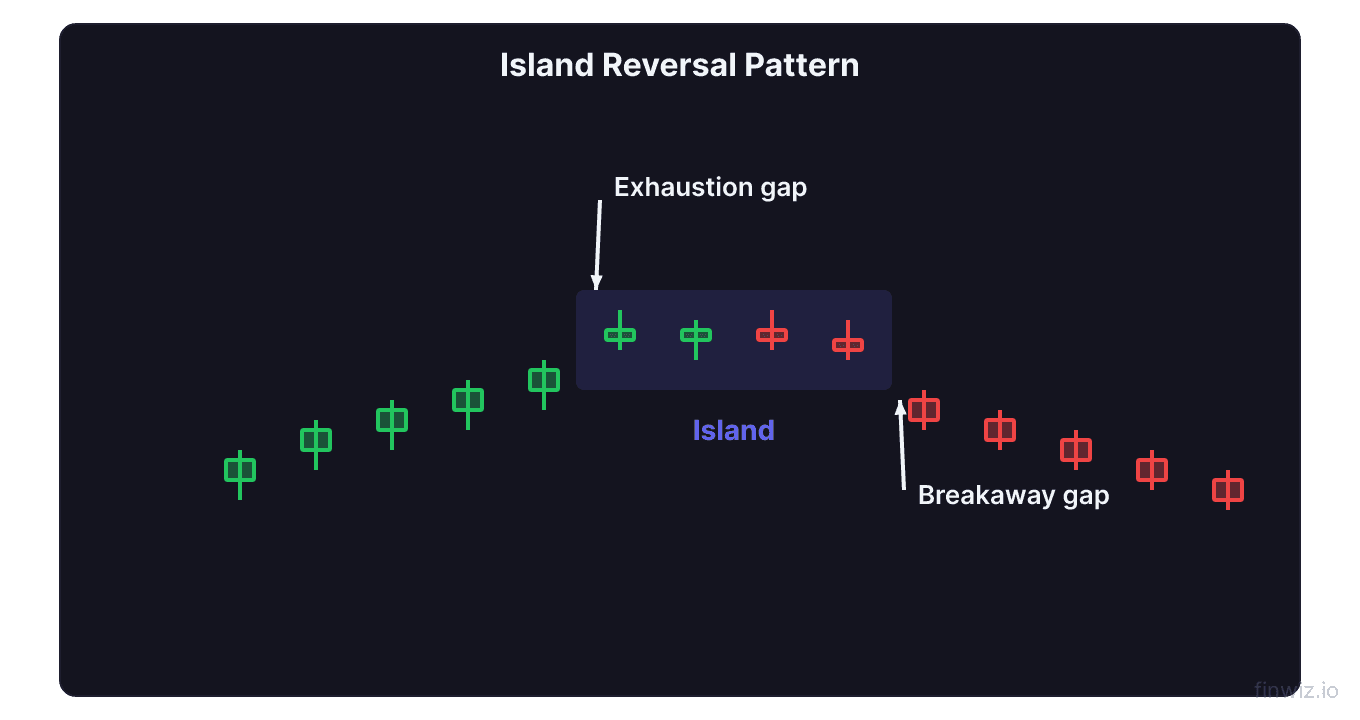
- An island reversal is a rare but powerful chart pattern where a cluster of trading days is isolated between two gaps — an exhaustion gap in one direction followed by a breakaway gap in the opposite direction
- The pattern appears as a "price island" separated from the surrounding price action, creating a visual gap on both sides of the isolated trading cluster
- Bullish island reversals occur at market bottoms (gap down, isolated trading, gap back up) and signal the end of a downtrend
- Bearish island reversals occur at market tops (gap up, isolated trading, gap back down) and signal the end of an uptrend
- Island reversals are among the most reliable reversal signals in technical analysis because they represent a dramatic shift in market sentiment from one side to the other
What Is an Island Reversal?
An island reversal is a chart pattern formed when a group of candles (typically 1 to several trading days) becomes isolated from the surrounding price action by two gaps — one gap separating the island from the prior trend and a second gap separating it from the new trend in the opposite direction. The result is a cluster of prices that appears to float alone, like an island surrounded by water.
This pattern is one of the rarest and most significant formations in technical analysis. It signals a dramatic and sudden shift in market sentiment — buyers and sellers essentially swap dominance so abruptly that a gap appears on both sides of the transition zone. When an island reversal forms, it often marks a major turning point that initiates weeks or months of price movement in the new direction.
The power of the island reversal lies in the fact that it combines two significant gap types — an exhaustion gap (the final push of the old trend) and a breakaway gap (the beginning of the new trend) — into a single, compact formation. Each gap is meaningful on its own; together, they create one of the most reliable reversal signals available.
The Exhaustion Gap and the Breakaway Gap
Understanding the two gaps that create an island reversal is essential for identifying and trading the pattern correctly.
The Exhaustion Gap
The exhaustion gap is the first gap in the island reversal sequence. It occurs in the direction of the existing trend — upward in an uptrend or downward in a downtrend. This gap represents the final burst of momentum from the prevailing trend, driven by the last wave of participants jumping in (late buyers in an uptrend or panic sellers in a downtrend).
The exhaustion gap often occurs on high volume as the remaining holdouts capitulate. In an uptrend, it is the final euphoric gap up. In a downtrend, it is the final panic gap down. The name "exhaustion" captures the idea that the trend has used up its remaining energy.
The Breakaway Gap
The breakaway gap is the second gap in the sequence, occurring in the opposite direction of the exhaustion gap. It separates the island from the new trend direction and represents a sudden, powerful shift in sentiment.
The breakaway gap should also occur on strong volume, confirming that the reversal has genuine participation behind it. This gap "breaks away" from the island, leaving it stranded between two price voids.
Bearish Island Reversal Structure (Top Reversal):Identifying Bearish Island Reversals (Top)
A bearish island reversal forms at the top of an uptrend and signals the beginning of a decline. Here is the step-by-step identification process.
Step 1: Confirm the uptrend. The stock should be in a clear uptrend, ideally with accelerating momentum. The pattern is more significant when it occurs after an extended rally or near a major resistance level.
Step 2: Identify the exhaustion gap up. The stock gaps above the previous session's high, often on a news catalyst or earnings beat. Volume may spike as the last buyers rush in. This gap feels like a continuation but is actually the trend's last breath.
Step 3: Watch the island trading. For one to several days, the stock trades in a narrow range at the elevated level. It holds the gap up but fails to make further progress. Volume often declines during this period — a warning sign that buying enthusiasm is fading.
Step 4: Confirm the breakaway gap down. The stock gaps below the island's low, creating a void between the island and the new lower prices. This gap should occur on increasing volume, confirming that sellers have seized control. The gap should not be filled in the sessions immediately following.
Step 5: Verify the unfilled gaps. For the island reversal to remain valid, neither gap should be filled (meaning the price should not trade back into the island's range). Filled gaps invalidate the pattern.
Pro Tip
The most reliable island reversals feature a clear price gap on both sides — not just a one-cent gap that could be attributed to noise. Look for gaps of at least 1-2% of the stock's price on both sides. Additionally, the island should be compact (1-5 trading days for maximum reliability). Islands spanning more than 7-10 days lose their visual and analytical clarity.
Identifying Bullish Island Reversals (Bottom)
A bullish island reversal forms at the bottom of a downtrend and signals the beginning of a recovery. The mechanics are the mirror image of the bearish version.
The stock is in a downtrend, gaps down on a final wave of panic selling (exhaustion gap), trades in a narrow range at the depressed level for a few days (the island), and then gaps up sharply (breakaway gap), leaving the island isolated below the new price level.
Bullish island reversals are particularly powerful when they occur:
- Near significant long-term support levels
- At Fibonacci retracement levels from prior advances
- With a volume climax on or near the exhaustion gap (extremely high volume indicating capitulation selling)
- After an extended, multi-week or multi-month downtrend
- Coincident with bullish divergence on RSI or MACD
Volume Confirmation
Volume is the critical validation tool for island reversals. The pattern is more reliable when volume follows this specific sequence:
- High volume on the exhaustion gap: Confirms that the old trend made its final push with conviction
- Declining volume on the island: Shows that momentum is drying up at the extreme level
- High volume on the breakaway gap: Confirms that the new trend direction has strong participation
If the breakaway gap occurs on low volume, the reversal is suspect. The gap may be filled, and the island pattern may fail. Always check volume bars before acting on an island reversal signal.
A useful confirmation technique is comparing the breakaway gap's volume to the stock's average daily volume. Volume that is 2x or more of the average provides strong confirmation. Volume at or below average is a warning sign.
Trading the Island Reversal
Entry Strategy
The most common entry for an island reversal trade is on the close of the breakaway gap day or on the opening of the following session, after confirming that the gap has held through the trading day. Entering during the gap itself carries the risk that the gap might fill during the session, invalidating the pattern.
For bearish island reversals (shorting), enter short after the breakaway gap down holds through the day's session. For bullish island reversals (buying), enter long after the breakaway gap up holds.
Stop-Loss Placement
Place your stop-loss at a level that would fill the breakaway gap. If the gap fills, the pattern has failed and your thesis is invalidated.
- Bearish island: Stop above the island's high (the top of the breakaway gap)
- Bullish island: Stop below the island's low (the bottom of the breakaway gap)
This placement provides a clearly defined, logical risk level. The stop distance determines your position size through the standard risk management calculation.
Price Targets
Island reversals often initiate significant moves, so targets can be aggressive:
- Minimum target: A move equal to the height of the island (measured from island high to island low) projected from the breakaway gap
- Standard target: The origin of the preceding trend (where the uptrend began for bearish islands, or where the downtrend began for bullish islands)
- Extended target: Key support/resistance levels from the historical chart, Fibonacci extensions, or prior pivot points
Bearish Island Reversal Target Example:Why Island Reversals Are Rare but Powerful
Island reversals are uncommon because they require a very specific sequence of events: a trend reaching exhaustion, a gap in the trend's direction, a period of indecision, and then a gap in the opposite direction. Most trends end with gradual rolling patterns (double tops, head and shoulders) rather than the sudden, gap-defined reversal that creates an island.
Their rarity is actually what makes them powerful. Because island reversals are uncommon, they represent genuinely exceptional shifts in supply and demand dynamics. When the market takes the unusual step of gapping away from a price level in both directions, it signals that something fundamental has changed in the participants' assessment of value.
Academic studies of gap patterns have found that breakaway gaps (the second gap in an island reversal) go unfilled approximately 70-80% of the time within the subsequent month, supporting the pattern's reliability as a directional signal.
Timeframe Considerations
Island reversals can form on any timeframe, but their significance and reliability vary.
Daily charts: The most common and reliable timeframe for island reversals. Gaps on daily charts represent overnight shifts in sentiment and are more significant than intraday gaps. A daily island reversal typically initiates a move lasting weeks to months.
Weekly charts: Island reversals on weekly charts are extremely rare but enormously significant. They represent a full week of trading isolated between two weekly gaps — a major structural shift. These patterns can signal the beginning of trend changes lasting months to years.
4-hour and intraday charts: Islands can appear on intraday charts, particularly around the market open when gaps are common. However, intraday island reversals are less reliable because gaps are more common (every session opens with a potential gap from the prior close) and more likely to be filled.
Pro Tip
When you spot a potential island reversal, check multiple timeframes for confirmation. An island reversal on the daily chart that aligns with a support/resistance level visible on the weekly chart is more powerful than one occurring at a random price level. The combination of pattern and level creates a higher-probability signal.
Common Mistakes When Trading Island Reversals
Acting before the breakaway gap confirms: Do not short on the island days expecting the breakaway gap. The island might resolve with a continuation gap in the original trend direction. Wait for the breakaway gap to form and hold.
Ignoring volume: An island reversal with low volume on the breakaway gap is unreliable. Do not trade the pattern without volume confirmation.
Setting stops too tight: Placing stops within the island range rather than beyond it leads to premature stop-outs. The stop must be beyond the island's extreme (high for bearish, low for bullish).
Confusing common gaps with island gaps: Not every gap creates an island reversal. Common gaps (which fill quickly) are routine in daily trading. Island reversals require two specific types of gaps — exhaustion and breakaway — in sequence. Single gaps are not island reversals.
Frequently Asked Questions
How often do island reversals occur?
Island reversals are among the rarest chart patterns, appearing far less frequently than head and shoulders, double tops, or triangle patterns. On any given stock, you might see one island reversal every few years on a daily chart. Their rarity is part of what makes them significant — when the market creates this unusual formation, it warrants serious attention.
Can island reversals fail?
Yes. Like all chart patterns, island reversals can produce false signals. The pattern fails when the breakaway gap is filled — meaning the price trades back into the island's range. If this happens, the sentiment shift was not genuine, and the original trend may resume. This is why stop-loss placement beyond the island is critical.
Do island reversals work in all markets?
Island reversals can form in any market that experiences gaps — stocks, futures, commodities, and some crypto markets. They do not form in markets that trade 24 hours (like most forex pairs) because continuous trading eliminates the overnight gaps necessary for the pattern. Markets with overnight sessions (equities, futures with limited hours) produce the most reliable island reversals.
What is the difference between an island reversal and a simple gap reversal?
A simple gap reversal involves a single gap that reverses the prior trend. An island reversal involves two gaps with an isolated cluster of trading between them. The island reversal is more significant because the double-gap structure demonstrates that the market not only reversed but did so with enough force to leave a stranded cluster of prices — a stronger statement of sentiment change.
Should I wait for the gap to be tested before entering?
Some traders wait for the breakaway gap to be "tested" (price approaches the gap but does not fill it) before entering. This provides additional confirmation but may cause you to miss trades where the gap is never tested and the stock moves aggressively in the new direction. A reasonable compromise is entering a half position at the breakaway gap and adding the second half on a successful gap test.
Disclaimer
This is educational content, not financial advice. Trading involves risk, and you should consult a qualified financial advisor before making any investment decisions. Past performance does not guarantee future results.
Related Articles
12 chapters covering charts, indicators, risk management & more. Plus weekly trading insights.