Gravestone Doji: Bearish Reversal Candlestick at the Top
⚡ Key Takeaways
- A gravestone doji is a bearish candlestick pattern with a long upper wick (shadow) and the open, close, and low all at or near the same price at the bottom of the candle
- The pattern signals that buyers pushed prices significantly higher during the session but sellers overwhelmed them by the close, indicating failed bullish momentum
- Gravestone dojis are most significant when they appear at the top of an uptrend or at a resistance level, suggesting a potential reversal
- Confirmation is essential — a bearish candle following the gravestone doji with above-average volume strengthens the reversal signal
- The gravestone doji is closely related to the shooting star but differs in that the open and close are at the very bottom of the range rather than having a small real body
What Is a Gravestone Doji?
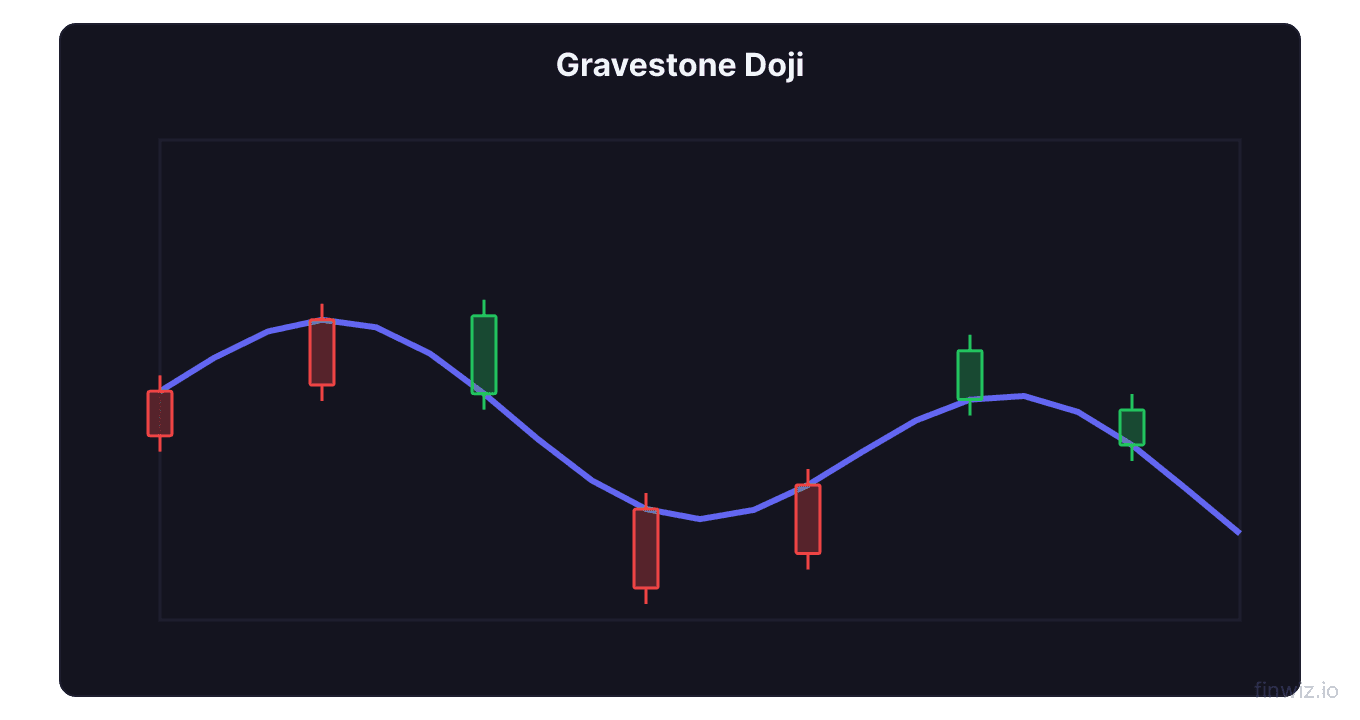
A gravestone doji is a bearish single-candlestick reversal pattern characterized by a long upper wick (shadow) with the open, close, and low all occurring at or very near the same price at the bottom of the candle. The pattern visually resembles an upside-down "T" or, as its name suggests, a gravestone. It signals that buyers attempted to drive the price significantly higher during the trading session but ultimately failed, with sellers pushing the price back down to where it opened by the close.
The gravestone doji is one of several doji candlestick variations. What distinguishes it from other dojis is the long upper shadow with virtually no lower shadow. This specific structure tells a clear story of rejected bullish momentum and is most meaningful when it appears at the top of an uptrend or at a key resistance level.
Anatomy of a Gravestone Doji
Understanding the precise structure of a gravestone doji helps you identify it correctly on price charts and distinguish it from similar patterns.
Open and close: The opening price and closing price are at or very near the same level, both located at or near the session's low. In a perfect gravestone doji, open equals close equals low. In practice, a small tolerance is acceptable — the open and close should be within a few cents of each other and near the bottom of the candle's range.
Upper wick (shadow): The long upper shadow represents the distance between the session's high and the open/close. This shadow should be at least two to three times the height of any small real body that may exist. The longer the upper shadow, the more significant the rejection of higher prices and the stronger the bearish signal.
Lower wick: Ideally, there is no lower wick at all, meaning the stock never traded below the opening price. A very small lower wick is acceptable, but a significant lower wick disqualifies the candle as a gravestone doji.
| Component | Gravestone Doji Requirement | Significance |
|---|---|---|
| Open | At or near session low | Buyers started from the bottom |
| Close | At or near session low (same as open) | Sellers pushed price back to open |
| High | Significantly above open/close | Buyers initially pushed prices up strongly |
| Low | At or near open/close | No selling below the open |
| Upper shadow | Long (dominant feature) | Shows extent of bullish failure |
| Lower shadow | None or minimal | Confirms open = low |
| Real body | None or very small | Open ≈ Close confirms indecision/reversal |
The Psychology Behind the Gravestone Doji
The gravestone doji tells a compelling story about the battle between buyers and sellers during a trading session.
At the open, buyers and sellers are in balance at the opening price. During the session, bulls take control and drive the price significantly higher. This could be driven by positive news, momentum buying, or optimism. The stock reaches its session high, and it appears that the bulls are in full control.
However, at some point during the session, sellers emerge in force. They overwhelm the buyers and push the price all the way back down to the opening level. By the close, all of the session's gains have been erased. Every buyer who purchased during the intraday rally is now underwater or at breakeven.
This complete rejection of higher prices is what makes the gravestone doji bearish. It demonstrates that at current price levels, there is sufficient selling pressure to absorb all buying demand and push the price back to its starting point. If this occurs at the top of an uptrend, it suggests that the trend may be exhausting as sellers gain strength.
The psychology is particularly powerful because traders who bought during the session's rally are now holding positions at a loss. If selling continues the next day, these traders may cut their losses, adding more selling pressure and confirming the reversal.
Where the Gravestone Doji Is Most Significant
Context determines whether a gravestone doji is a meaningful reversal signal or just noise. The same pattern carries vastly different implications depending on where it appears.
Top of an uptrend. This is the highest-significance location for a gravestone doji. After an extended run higher, the appearance of a gravestone doji signals that buyers are losing conviction and sellers are stepping in. The longer the preceding uptrend, the more meaningful the signal.
At a known resistance level. When a gravestone doji forms at a price level that has previously acted as resistance (a prior high, a round number like $100 or $200, or a moving average like the 200-day), the pattern gains significance because it confirms the resistance level's validity.
After a gap up. A gravestone doji that opens with a gap up from the previous close is especially bearish. The gap represents initial enthusiasm that was completely reversed by the close, leaving a potential exhaustion gap that often marks the end of a move.
At Bollinger Band upper boundary. When price reaches the upper Bollinger Band and forms a gravestone doji, it suggests the stock has stretched too far above its mean and is likely to revert.
| Location | Signal Strength | Reason |
|---|---|---|
| Top of extended uptrend | Strong bearish | Trend exhaustion at its most likely point |
| At major resistance level | Strong bearish | Resistance confirmed by pattern |
| After gap up | Very strong bearish | Enthusiasm fully reversed |
| Mid-trend, no resistance | Weak | May just be a pause, not a reversal |
| Bottom of downtrend | Insignificant | Contradicts the pattern's bearish nature |
| In a range-bound market | Moderate | Context-dependent, needs other confirmation |
Pro Tip
Confirmation: Why You Need the Next Candle
A gravestone doji alone is a warning signal, not an action signal. Experienced traders wait for confirmation before entering bearish positions because single-candle patterns can and do fail frequently.
Confirmation criteria:
- Bearish follow-through candle. The next day's candle should close below the gravestone doji's low. Ideally, it is a strong bearish candle (large red/black body) that demonstrates continued selling pressure.
- Volume increase on confirmation. If the confirmation candle occurs on higher volume than the gravestone doji, it adds conviction that sellers are in control.
- Break of support. If the confirmation candle also breaks below a nearby support level (such as the 20 EMA, a prior swing low, or a trendline), the bearish case is significantly strengthened.
Without confirmation, the gravestone doji may simply represent a one-day pause in an ongoing uptrend. Stocks frequently form gravestone dojis at minor resistance levels, consolidate briefly, and then continue higher. Trading the pattern without waiting for confirmation leads to premature bearish entries that get stopped out when the uptrend resumes.
| Scenario | Confirmation Present? | Action |
|---|---|---|
| Gravestone doji + bearish candle below doji low | Yes | Enter bearish position (short or put) |
| Gravestone doji + candle closes above doji high | No — pattern failed | No action, uptrend likely continues |
| Gravestone doji + small indecision candle | Incomplete | Wait another day for clear direction |
| Gravestone doji + gap down next day | Strong yes | Enter bearish position with high conviction |
Gravestone Doji vs. Shooting Star
The gravestone doji and the shooting star are closely related bearish reversal patterns that are frequently confused. Understanding their differences helps you classify candles correctly.
| Feature | Gravestone Doji | Shooting Star |
|---|---|---|
| Real body | None or extremely small (open ≈ close ≈ low) | Small real body near the bottom |
| Open vs. close | Essentially equal | Close is slightly below open (bearish body) or slightly above (bullish body) |
| Upper shadow | At least 2-3x any real body | At least 2x the real body |
| Lower shadow | None or minimal | Small or none |
| Preceding trend | Uptrend required | Uptrend required |
| Signal strength | Slightly stronger (more rejection) | Strong |
| Frequency | Less common | More common |
In practice, the distinction is subtle. Both patterns communicate the same message: buyers pushed prices higher but sellers reversed the gains. The gravestone doji is considered slightly more bearish because the complete erasure of gains (open = close = low) represents a more thorough rejection than a shooting star's small residual body.
Trading implication: Do not agonize over whether a candle is technically a gravestone doji or a shooting star. Both carry the same bearish message. Focus on context (uptrend? resistance level? volume?) and confirmation rather than exact candle classification.
Trading the Gravestone Doji
Here is a practical framework for trading gravestone doji reversals.
Entry: Wait for confirmation — enter a short position or buy puts when the next candle closes below the gravestone doji's low. For conservative traders, wait for a close below a nearby support level (such as the 10 or 20 EMA) for additional confidence.
Stop-loss: Place the stop-loss above the gravestone doji's high. This is the rejection point — if price exceeds the high of the gravestone candle, the reversal thesis is invalidated and the uptrend is resuming.
Profit target: Use a risk-reward ratio of at least 2:1. If the distance from entry to stop-loss is $3, target at least $6 of downside. Alternatively, target the next major support level, the 50-day moving average, or a prior consolidation zone.
Example: A stock in an uptrend reaches $150 and forms a gravestone doji with a high of $155, open/close/low at $150. The next day, it closes at $148 (below the doji's low of $150), confirming the reversal.
- Entry: $148 (confirmation close)
- Stop-loss: $156 (above the doji high of $155 plus buffer)
- Risk: $8 per share
- Target: $132 (2:1 risk-reward, $16 below entry)
Gravestone Doji on Different Timeframes
Weekly chart gravestone dojis are the most significant because they represent an entire week of price action where buyers were rejected. A weekly gravestone doji at a major resistance level is a powerful reversal signal that can precede multi-week or multi-month declines.
Daily chart gravestone dojis are the standard analysis timeframe. They appear frequently enough to provide regular trading opportunities while carrying sufficient significance for reliable signals (when confirmed and in the right context).
Intraday charts produce gravestone dojis frequently, but their significance is proportionally reduced. A gravestone doji on a 5-minute chart may simply reflect a brief pause in intraday momentum, not a meaningful reversal. Use intraday gravestone dojis only in conjunction with major intraday levels like VWAP or key support/resistance zones.
Common Mistakes with Gravestone Dojis
Trading every gravestone doji without context. Gravestone dojis that appear in the middle of a trading range or at the bottom of a downtrend carry little significance. The pattern is only meaningful as a bearish reversal signal at the top of an uptrend or at resistance.
Skipping confirmation. Entering a short position immediately upon seeing a gravestone doji, without waiting for a confirming bearish candle, exposes you to frequent false signals. The one-day wait for confirmation significantly improves the pattern's reliability.
Setting stops too tight. Placing the stop-loss at the exact high of the gravestone doji leaves no room for normal price fluctuation. Add a buffer of a few cents or 0.5% above the doji's high to avoid being stopped out by minor noise.
Ignoring the broader trend context. A gravestone doji during a strong, high-ADX uptrend is less likely to produce a meaningful reversal than one that appears after a choppy, exhausted advance. Consider the trend's maturity and strength when assessing the signal.
Frequently Asked Questions
Is a gravestone doji always bearish?
A gravestone doji is bearish by nature because it represents a rejection of higher prices. However, its bearish implications are only significant when it appears in the right context — specifically at the top of an uptrend or at a resistance level. A gravestone doji in the middle of a range or at the bottom of a downtrend does not carry the same bearish weight. Even in the correct context, confirmation from the following candle is necessary before acting on the signal.
How reliable is the gravestone doji as a reversal signal?
On its own, the gravestone doji has moderate reliability — studies suggest single-candle patterns correctly predict reversals roughly 50% to 60% of the time. However, when combined with proper context (top of uptrend, at resistance), confirmation (bearish follow-through candle), and volume analysis (above-average volume), the reliability improves significantly. No candlestick pattern should be traded in isolation. The gravestone doji is a warning sign that initiates further analysis, not an automatic trade trigger.
What is the difference between a gravestone doji and a dragonfly doji?
The gravestone doji and dragonfly doji are mirror images of each other. The gravestone doji has a long upper shadow with the open/close/low at the bottom (bearish). The dragonfly doji has a long lower shadow with the open/close/high at the top (bullish). The dragonfly doji signals that sellers pushed prices lower during the session but buyers reversed the decline, making it a potential bullish reversal signal at the bottom of a downtrend.
Can a gravestone doji appear at the bottom of a downtrend?
A gravestone doji can technically appear anywhere, but at the bottom of a downtrend, its significance is minimal or even contradictory to its normal bearish interpretation. Some traders view a bottom-of-trend gravestone doji as a sign of buyer interest (they attempted to push prices higher), but the failure to hold gains is generally not a bullish signal. At the bottom of a downtrend, look for bullish reversal patterns like the dragonfly doji, hammer, or bullish engulfing instead.
Should I combine the gravestone doji with other indicators?
Yes, always. The gravestone doji is most effective when combined with RSI readings above 70 (confirming overbought conditions), price at or near a known resistance level, a declining stochastic oscillator crossing down from above 80, and above-average volume. The more confirming signals that align with the gravestone doji, the higher the probability that the reversal will follow through. Using the doji as one piece of a multi-factor analysis framework is far more effective than relying on the candle pattern alone.
Disclaimer
This is educational content, not financial advice. Trading involves risk, and you should consult a qualified financial advisor before making any investment decisions. Past performance does not guarantee future results.
12 chapters covering charts, indicators, risk management & more. Plus weekly trading insights.