Engulfing Patterns: Bullish & Bearish Reversal Candles
⚡ Key Takeaways
- An engulfing pattern is a two-candle reversal formation where the second candle
- s body.
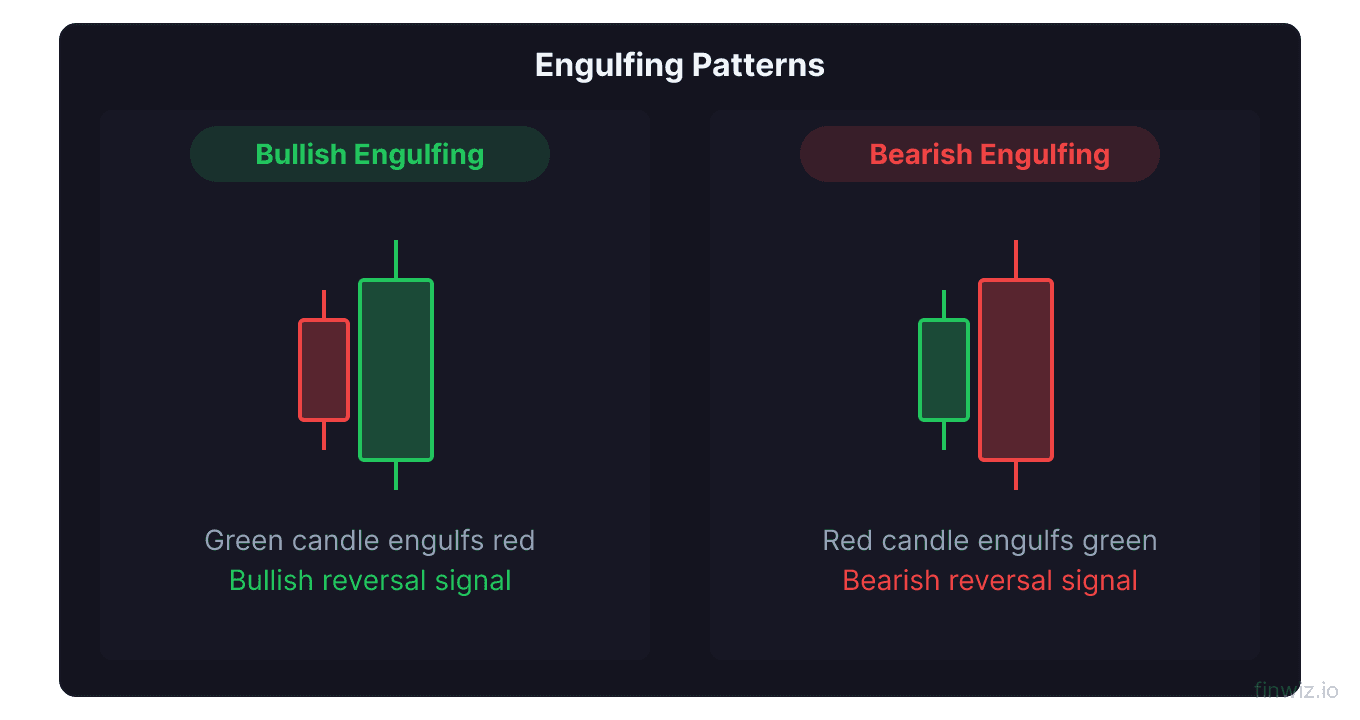
- A bullish engulfing pattern forms at the end of a downtrend when a large green candle engulfs a small red candle, signaling buyers overpowering sellers.
- A bearish engulfing pattern forms at the end of an uptrend when a large red candle engulfs a small green candle, signaling sellers overpowering buyers.
- Volume should increase on the engulfing candle to confirm that genuine participation is driving the reversal.
- Engulfing patterns are most reliable at key support and resistance levels and when confirmed by momentum indicators like RSI.
What Is an Engulfing Pattern?
The engulfing pattern is a two-candle reversal formation and one of the most powerful and frequently traded candlestick patterns in technical analysis. It signals an abrupt shift in the balance of power between buyers and sellers, often marking the beginning of a new directional move.
The pattern gets its name from the second candle's body, which completely "engulfs" or covers the first candle's body. This visual representation shows that the side that was previously in control (the direction of the first candle) has been overwhelmed by the opposing force (the direction of the second candle).
There are two types: the bullish engulfing (appearing at the bottom of downtrends) and the bearish engulfing (appearing at the top of uptrends). Both carry significant reversal implications, particularly when they form at key price levels with supporting volume.
The Bullish Engulfing Pattern
The bullish engulfing pattern consists of two candles that appear during or at the end of a downtrend.
Structure
The first candle is a small-bodied bearish (red) candle, reflecting the prevailing downtrend. The second candle is a larger bullish (green) candle whose body opens below the first candle's close and closes above the first candle's open, completely covering the first candle's real body.
The key requirement is that the second candle's body must fully engulf the first candle's body. The wicks do not need to be engulfed, only the real bodies. However, a second candle that also engulfs the first candle's wicks provides an even stronger signal.
What It Tells You
The bullish engulfing pattern tells a vivid story of market psychology. Sellers entered the session believing the downtrend would continue, initially pushing prices lower (the second candle opens below the first candle's close). But during the session, buyers overwhelmed the sellers so decisively that the price reversed and closed above where sellers started the previous session.
This dramatic intra-session reversal shows that demand has emerged with enough force to not just absorb selling pressure but to drive prices significantly higher. The buyers have "engulfed" the sellers.
Trading the Bullish Engulfing
Entry: Buy at the close of the engulfing candle or at the open of the next session. More conservative traders wait for the next candle to close above the engulfing candle's close for additional confirmation.
Stop loss: Place the stop below the low of the engulfing pattern (the lower of the two candles' lows). This represents the maximum extent of selling pressure during the pattern formation.
Target: Use the nearest resistance level, a measured move equal to the engulfing candle's body length projected from the close, or trail the position using a moving average.
Pro Tip
The Bearish Engulfing Pattern
The bearish engulfing pattern is the mirror image of the bullish version, appearing during or at the end of an uptrend.
Structure
The first candle is a small-bodied bullish (green) candle, consistent with the uptrend. The second candle is a larger bearish (red) candle whose body opens above the first candle's close and closes below the first candle's open, completely covering the first candle's real body.
What It Tells You
The bearish engulfing reveals that sellers have overtaken buyers decisively. Buyers entered the session expecting the uptrend to continue, but sellers emerged with such force that they erased all of the prior session's gains and then some. The psychological impact on market participants is significant: bulls who were confident are now uncertain, while bears are emboldened.
Trading the Bearish Engulfing
Entry: Sell short at the close of the engulfing candle or at the open of the next session. Conservative traders wait for the next candle to close below the engulfing candle's low.
Stop loss: Place the stop above the high of the engulfing pattern.
Target: Use the nearest support level or trail with a moving average.
| Aspect | Bullish Engulfing | Bearish Engulfing |
|---|---|---|
| Trend Context | Bottom of downtrend | Top of uptrend |
| First Candle | Small bearish (red) | Small bullish (green) |
| Second Candle | Large bullish (green) | Large bearish (red) |
| Signal | Bullish reversal | Bearish reversal |
| Entry | Buy at or after close | Sell/short at or after close |
| Stop | Below pattern low | Above pattern high |
Volume Confirmation
Volume is a critical confirmation factor for engulfing patterns.
The engulfing candle (the second, larger candle) should show above-average volume. This volume surge confirms that the reversal is driven by genuine participation, not just a thin market anomaly. Ideally, volume on the engulfing candle should be significantly higher than volume on the first candle.
When a bullish engulfing occurs at support on volume that is 2-3 times the recent average, the signal is exceptionally strong. Similarly, a bearish engulfing at resistance on heavy volume provides a high-conviction shorting opportunity.
Volume comparison with prior sessions also matters. If the engulfing candle's volume is the highest in the past 10-20 sessions, it signals a significant shift in market participation that is likely to produce follow-through.
Pro Tip
Ideal Locations for Engulfing Patterns
Where the pattern forms on the chart dramatically affects its reliability.
At major support (bullish) or resistance (bearish) levels: When an engulfing pattern coincides with a well-established support or resistance level, the probability of a successful reversal increases significantly. The pattern represents the market's reaction at a price level where supply or demand historically shifts.
At moving averages: Bullish engulfing patterns at the rising 50-day or 200-day moving average combine the pattern's reversal signal with the dynamic support of a major moving average. Similarly, bearish engulfing patterns at falling moving averages add confluence.
At trendline touches: Engulfing patterns that form when price touches a major trendline (support or resistance) gain additional significance from the trendline's influence.
At Fibonacci levels: When price retraces to a key Fibonacci level and forms an engulfing pattern, the dual confirmation creates a higher-probability trade setup.
Engulfing Patterns vs. Other Reversal Patterns
Understanding how engulfing patterns compare to related formations helps you select the right tool for each situation.
Engulfing vs. Hammer/Shooting Star
The hammer and shooting star are single-candle patterns, while the engulfing pattern uses two candles. Engulfing patterns are generally considered more reliable because they demonstrate an actual shift in control over two sessions rather than a single session of price rejection. The two-candle structure shows that the reversal has persistence.
Engulfing vs. Morning Star/Evening Star
The morning star and evening star are three-candle patterns that include an indecision candle (often a doji) between the two directional candles. They show a more gradual transition than the abrupt reversal of an engulfing pattern. Both pattern types are effective; the engulfing pattern provides a faster signal, while the morning/evening star provides a more measured confirmation.
Engulfing vs. Piercing Line/Dark Cloud Cover
The piercing line is a bullish two-candle pattern where the second candle closes above the midpoint of the first candle but does not fully engulf it. The dark cloud cover is the bearish equivalent. These patterns are weaker versions of the engulfing pattern because the second candle does not completely overcome the first candle's range. Engulfing patterns carry more weight because they show complete domination by the reversing side.
Multi-Timeframe Engulfing Analysis
Using engulfing patterns across multiple timeframes can significantly improve your trading results.
Top-down approach: Identify engulfing patterns on higher timeframes (weekly or daily) to determine the broader directional bias. Then use lower timeframes (4-hour or 1-hour) to fine-tune entries within the context of the higher-timeframe signal.
A weekly bullish engulfing pattern establishes a bullish bias for the coming week. Daily and intraday bullish patterns within that week can then be traded with higher confidence because they align with the higher-timeframe reversal.
Nested engulfing patterns are rare but powerful. When a daily bullish engulfing pattern forms during the same week that produces a weekly bullish engulfing, the combined signal from two timeframes creates exceptional conviction.
False Engulfing Patterns
Not every engulfing pattern leads to a successful reversal. Understanding failure modes helps you manage risk.
Low-volume engulfing patterns are the most common false signals. Without volume confirmation, the engulfing candle may represent a temporary reaction rather than a genuine shift in control.
Engulfing patterns in the middle of ranges are unreliable. The pattern gains its power from appearing at trend extremes. When it forms in the middle of a trading range, neither side has the contextual advantage needed for a sustained reversal.
Counter-trend engulfing patterns can fail when the prevailing trend is very strong. A single bullish engulfing candle in a powerful downtrend may produce a temporary bounce but is unlikely to reverse the entire trend. In strong trends, treat engulfing patterns as potential short-term moves rather than trend reversals.
Event-driven engulfing patterns that form around earnings reports, economic data releases, or central bank decisions may be driven by the event rather than by a sustainable shift in supply and demand. These patterns have lower follow-through rates because the initial reaction to news can be reversed within the next few sessions.
Position Sizing and Risk Management
Proper position sizing is essential for engulfing pattern trades.
Calculate the distance from your entry to your stop loss (the pattern's extreme). Determine how many shares or contracts you can trade while keeping total dollar risk within 1-2% of your account value. This calculation ensures that even a failed pattern does not cause significant damage to your trading capital.
Scaling in can be effective with engulfing patterns. Take a half position on the engulfing signal, then add the second half if the next candle confirms with a close in the direction of the engulfing candle. This approach reduces initial risk while maintaining exposure to the full move.
Trailing stops help maximize gains from successful engulfing trades. After the initial move in your favor, trail the stop behind recent swing lows (for bullish trades) or swing highs (for bearish trades). Alternatively, use the 10-day or 20-day moving average as a trailing reference.
Building an Engulfing Pattern Strategy
To systematically trade engulfing patterns, create a rules-based approach.
Filters: Only trade engulfing patterns that meet all of the following criteria: clear trend context (downtrend for bullish, uptrend for bearish), proximity to a major support or resistance level, above-average volume on the engulfing candle, and RSI confirming the signal (oversold for bullish, overbought for bearish).
Position management: Enter on the close of the engulfing candle, stop below the pattern extreme, initial target at the nearest significant level, trail remaining position with a moving average.
Record keeping: Track every engulfing pattern trade with detailed notes on context, volume, indicator readings, and outcomes. This data will reveal which filters and conditions produce the best results in your specific market and timeframe.
Frequently Asked Questions
What is the difference between engulfing and outside bar patterns?
The terms are closely related but come from different charting traditions. An engulfing pattern specifically refers to the Japanese candlestick definition where the second candle's body (open to close range) engulfs the first candle's body. An outside bar is a Western bar chart term where the second bar's entire range (high to low) engulfs the first bar's entire range. An outside bar is a slightly stricter requirement because it requires the wicks to be engulfed as well. Every outside bar contains an engulfing pattern, but not every engulfing pattern qualifies as an outside bar.
How reliable are engulfing patterns compared to other candlestick patterns?
Engulfing patterns are generally considered among the most reliable candlestick patterns, with success rates estimated at 60-70% when properly confirmed with volume and level context. They tend to outperform single-candle patterns like hammers and shooting stars because the two-candle structure provides more information about the shift in market sentiment. However, three-candle patterns like the morning star and evening star may be slightly more reliable in some studies because they show an additional confirmation candle. The most important factor is not the pattern itself but the quality of the context in which it appears.
Can engulfing patterns be used for day trading?
Yes, engulfing patterns can be effective for day trading, particularly on the 15-minute and 1-hour timeframes. For intraday use, focus on engulfing patterns that form at key levels such as the previous day's high or low, the VWAP, or major intraday support and resistance levels. Volume confirmation is especially important for intraday engulfing patterns because lower-timeframe signals are inherently noisier. Many day traders combine intraday engulfing patterns with the daily chart's trend direction, only taking intraday bullish engulfing signals when the daily trend is up and vice versa.
Do the wicks need to be engulfed for a valid pattern?
No, the standard definition of an engulfing pattern only requires the second candle's body to engulf the first candle's body. The wicks do not need to be engulfed. However, when the second candle does engulf the first candle's entire range including wicks, the signal is stronger because it shows that the reversing side completely dominated all of the prior session's price action. This stronger version is essentially an outside bar or outside day, and it carries additional significance because it represents a more complete reversal of the prior session's activity.
What if the two candles are nearly the same size?
If the second candle barely engulfs the first candle (with only a minimal overlap), the signal is weaker than when there is a significant size difference. The power of the engulfing pattern comes from the second candle's dominance over the first, and a marginal engulfing does not demonstrate convincing dominance. Look for engulfing patterns where the second candle's body is at least 50% larger than the first candle's body. The greater the size differential, the stronger the signal. Marginal engulfing patterns should be treated with extra caution and require stronger confirmation from other factors.
Disclaimer
This is educational content, not financial advice. Trading involves risk, and you should consult a qualified financial advisor before making any investment decisions. Past performance does not guarantee future results.
12 chapters covering charts, indicators, risk management & more. Plus weekly trading insights.