Double Top & Double Bottom Patterns: Reversal Signals Explained
⚡ Key Takeaways
- The double top is a bearish reversal pattern that forms when price tests the same resistance level twice and fails to break through.
- The double bottom is a bullish reversal pattern that forms when price tests the same support level twice and holds.
- The neckline (the swing low between the two tops, or swing high between the two bottoms) serves as the confirmation trigger level.
- Volume typically decreases on the second peak or trough, signaling weakening momentum in the prevailing trend direction.
- The measured move target equals the height of the pattern projected from the neckline breakout point.
What Are Double Top and Double Bottom Patterns?
Double top and double bottom patterns are among the most recognizable reversal formations in technical analysis. They signal that the prevailing trend is losing momentum and a reversal may be imminent. These patterns are popular because they are relatively easy to identify and provide clear entry, stop, and target levels.
A double top forms during an uptrend when price reaches the same resistance level twice and is rejected both times, creating an "M" shape on the chart. A double bottom forms during a downtrend when price reaches the same support level twice and bounces both times, creating a "W" shape.
These patterns work because they reveal a fundamental truth about market dynamics: when price fails to break through a level on a second attempt, it demonstrates that the opposing force (sellers at resistance or buyers at support) is strong enough to hold, making a reversal more likely.
Structure of the Double Top
The double top consists of three key components that traders must identify correctly.
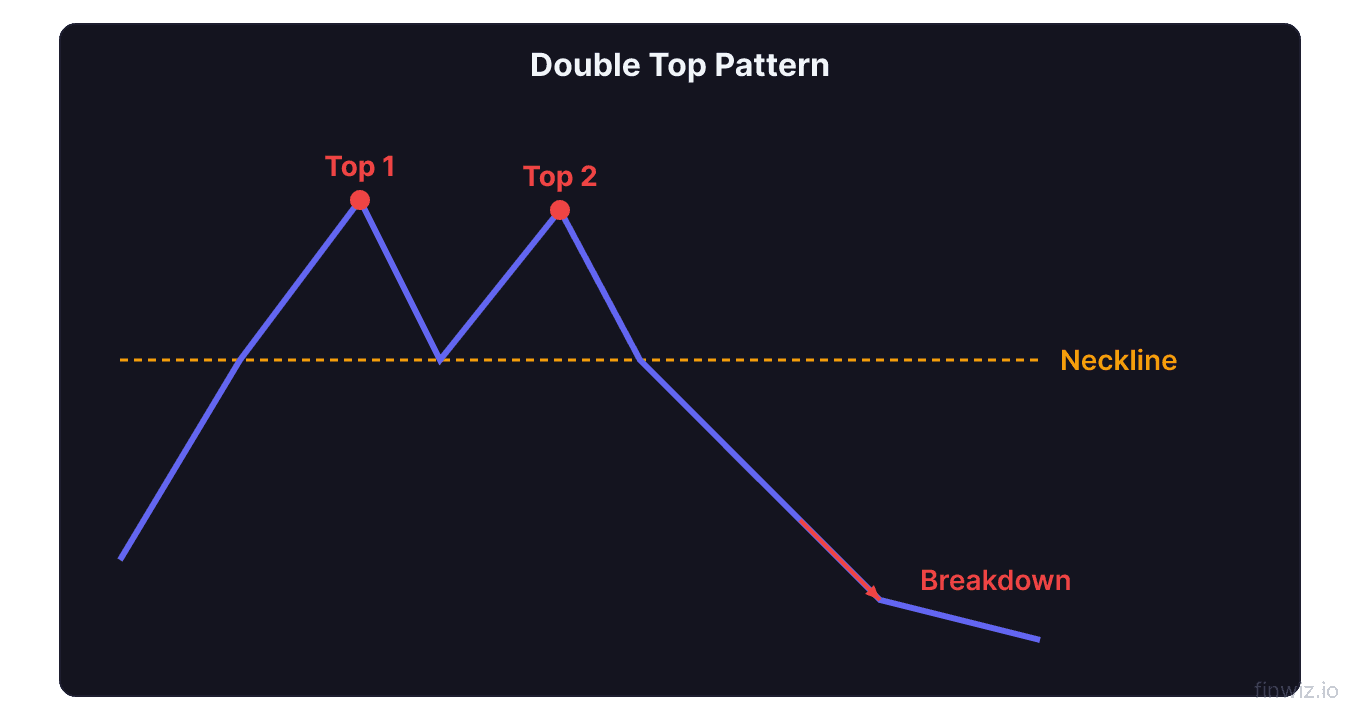
First Peak
The first peak forms during an existing uptrend as price reaches a new high and then pulls back. At this stage, the pullback looks like a normal correction within the trend. Nothing about the first peak alone signals a reversal. Volume is typically solid during the rally to the first peak, consistent with the uptrend.
The Valley (Neckline)
The pullback from the first peak creates a swing low known as the valley or neckline. This level becomes the critical trigger point for the pattern. The valley represents temporary support, and its eventual breakdown confirms the double top. The depth of the valley typically ranges from 10% to 20% of the price.
Second Peak
The second peak occurs when price rallies back to approximately the same level as the first peak but fails to break above it. The two peaks do not need to be at the exact same price; a tolerance of 2-3% is acceptable. Volume on the second peak is typically lower than on the first peak, which is a crucial confirmation signal. The declining volume shows that buying enthusiasm is waning.
Pro Tip
Trading the Double Top
Once the pattern is identified, the next step is planning the trade.
Confirmation
The double top is confirmed when price breaks below the neckline (the valley between the two peaks). Until this break occurs, the pattern remains unconfirmed, and the stock could still rally to new highs. Many traders wait for a daily close below the neckline rather than acting on an intraday breach.
Entry
Aggressive entry: Sell short or exit long positions when price closes below the neckline. This captures the earliest part of the move but carries higher risk of a false breakdown.
Conservative entry: Wait for the neckline to break and then be retested from below. The retest of the neckline as resistance provides a lower-risk entry with a tighter stop. However, not all double tops produce a retest.
Stop Loss
Place the stop loss above the second peak. If price exceeds the second peak, the double top pattern has failed, and the uptrend may continue. Some traders use a tighter stop just above the neckline after a retest entry.
Price Target
Price Target = Neckline - (Peak Price - Neckline)Measure the height of the pattern from the peaks to the neckline. Subtract that distance from the neckline. This gives the minimum expected decline.
Structure of the Double Bottom
The double bottom is the mirror image of the double top, appearing at market lows.
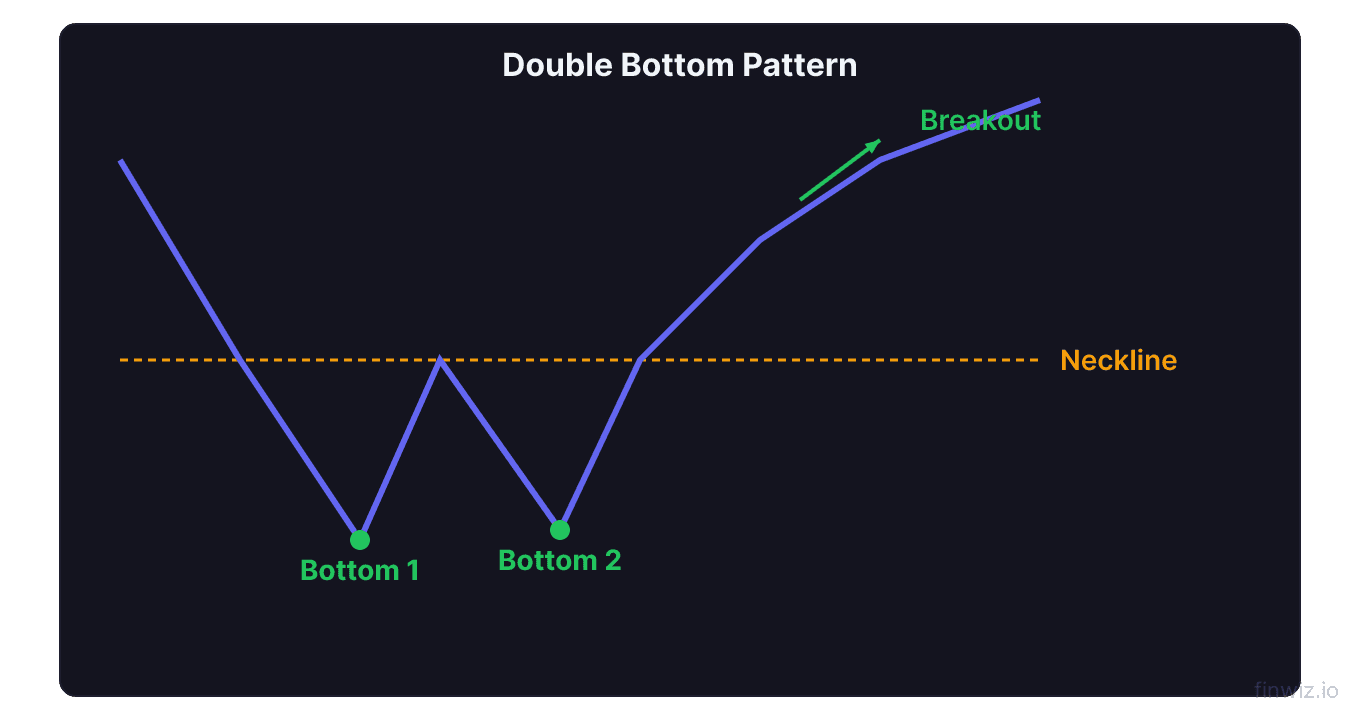
First Trough
The first trough forms during a downtrend when price hits a support level and bounces. Like the first peak in a double top, the initial bounce looks like a normal correction within the downtrend. Volume is typically high during the decline to the first trough.
The Peak (Neckline)
The bounce from the first trough creates a swing high that serves as the pattern's neckline. This level becomes the breakout trigger. The rally from the first trough should show moderate buying interest but not enough to signal a definitive trend reversal.
Second Trough
The second trough forms when price declines back to approximately the same level as the first trough and holds. Volume on the decline to the second trough should be lower than the first trough, indicating that selling pressure is diminishing. The bounce from the second trough, particularly on increasing volume, signals that buyers are gaining control.
Trading the Double Bottom
Confirmation and Entry
The double bottom is confirmed when price breaks above the neckline (the swing high between the two troughs). Buy on the breakout, ideally on volume that exceeds the recent average.
Conservative traders wait for a pullback to the neckline after the breakout, buying on the retest of the neckline as new support. This approach reduces false breakout risk.
Stop Loss and Target
Place the stop loss below the second trough. The measured move target equals the height of the pattern added to the neckline breakout point.
Price Target = Neckline + (Neckline - Trough Price)| Aspect | Double Top | Double Bottom |
|---|---|---|
| Trend Context | Uptrend | Downtrend |
| Shape | M-shaped | W-shaped |
| Signal | Bearish reversal | Bullish reversal |
| Confirmation | Break below neckline | Break above neckline |
| Volume | Declining on 2nd peak | Declining on 2nd trough |
| Stop Loss | Above second peak | Below second trough |
Volume Analysis in Double Patterns
Volume provides essential confirmation for both double tops and double bottoms.
In a double top, volume should be noticeably higher on the rally to the first peak than on the rally to the second peak. This declining volume pattern shows that fewer buyers are willing to push prices back to the high, weakening the bullish case. When the neckline breaks, volume should expand to confirm that sellers are actively entering the market.
In a double bottom, volume typically spikes on the decline to the first trough as panicked sellers dump their positions. The decline to the second trough should show lighter volume, suggesting that selling is exhausting itself. The rally from the second trough should show increasing volume, and the neckline breakout should occur on above-average volume.
Pro Tip
Common Variations
Real-world double tops and bottoms rarely look like perfect textbook examples.
Unequal Peaks or Troughs
The two peaks in a double top (or troughs in a double bottom) do not need to be at exactly the same price. A difference of 1-3% is common and acceptable. What matters is that the second attempt fails to significantly exceed the first, showing that the level is acting as a barrier.
Adam and Eve Patterns
An Adam and Eve double bottom features a sharp, V-shaped first trough (Adam) followed by a rounder, more gradual second trough (Eve). This variation is considered highly reliable because the rounded second trough indicates patient accumulation by smart money. The reverse applies to double tops.
Extended Patterns
Sometimes significant time passes between the two peaks or troughs, creating an extended double top or bottom. These larger patterns carry more significance because they involve more market participants and capital. An extended double top or bottom spanning several months on a daily chart can signal a major trend reversal.
Double Tops and Bottoms vs. Other Patterns
Understanding how double patterns relate to similar formations helps you choose the right analysis.
Compared to the head and shoulders, the double top lacks the middle peak (the head) that makes a higher high. The head and shoulders is generally considered a stronger reversal signal because it explicitly shows the transition from higher highs to a lower high. A double top shows failure at the same level, while a head and shoulders shows progressive weakening.
The double bottom and the cup and handle can sometimes look similar during formation. The key difference is the shape: a cup and handle has a rounded bottom, while a double bottom has two distinct troughs separated by a peak. Additionally, the cup and handle is a continuation pattern, while the double bottom is a reversal pattern.
Candlestick patterns like the engulfing pattern can form at the second peak or trough, adding confirmation to the double pattern. A bearish engulfing at the second peak of a double top, for example, strengthens the case for a breakdown.
False Double Tops and Bottoms
Not every double test of a level results in a reversal. Understanding false patterns is as important as identifying real ones.
A false double top occurs when price dips below the neckline briefly but then rallies back above it and eventually breaks above both peaks. This often triggers a powerful upside move as short sellers are squeezed.
A false double bottom occurs when price breaks above the neckline but then reverses and ultimately breaks below both troughs. This can lead to accelerated selling as trapped buyers exit their positions.
To reduce the risk of false signals, always require volume confirmation on the neckline break, consider waiting for a retest of the neckline, and check whether the broader market trend supports the pattern's implication.
Using Indicators for Confirmation
Several technical indicators can strengthen your double top and double bottom analysis.
The RSI is particularly useful. If the RSI makes a lower high at the second peak of a double top (bearish divergence), the reversal signal is strengthened significantly. Similarly, if the RSI makes a higher low at the second trough of a double bottom (bullish divergence), the bullish reversal signal gains credibility.
MACD divergence works similarly. When the MACD fails to confirm a new price extreme on the second peak or trough, it supports the double pattern's reversal implications.
Moving averages provide context. A double top that forms while price is crossing below its 50-day moving average has stronger bearish implications. A double bottom that forms near the 200-day moving average may establish a long-term support zone.
Risk Management Strategies
Proper risk management is essential when trading double patterns.
Position size based on the distance from your entry to your stop loss. With the stop above the second peak (for a double top short) or below the second trough (for a double bottom long), calculate the per-share risk and size your position so that total dollar risk does not exceed 1-2% of your account.
Partial profits can be taken at the halfway point to the measured move target, with the remainder trailing toward the full target. This approach secures some profit while maintaining exposure to the full move.
Track your results with a trading journal. Record the pattern type, volume characteristics, indicator confirmation, entry and exit prices, and outcome. Over time, this data reveals which variations of double patterns work best in your preferred market.
Frequently Asked Questions
How far apart should the two peaks or troughs be?
The two peaks in a double top or troughs in a double bottom should ideally be separated by at least 2-4 weeks on a daily chart, though the gap can range from a few weeks to several months. Peaks or troughs that form too close together (within a few days) may simply represent short-term volatility rather than a meaningful double pattern. Patterns with several weeks to months of separation carry more significance because they reflect multiple attempts by market participants to push through the level, each time being rejected.
How accurate are double top and double bottom patterns?
Studies suggest that double tops and double bottoms confirmed by a neckline break have a success rate of roughly 60-70%, depending on the market and timeframe. The accuracy improves significantly when combined with volume confirmation, RSI or MACD divergence, and proper trend context. False breakouts are the primary risk, which is why waiting for confirmation and using stop losses are essential components of any double pattern trading strategy.
Can a double top form in a downtrend?
A true double top forms in an uptrend as a reversal pattern. If you see two equal highs in a downtrend, it is more accurately described as a resistance level within a bear market rally rather than a double top. The trend context matters because the pattern's significance comes from signaling the end of the prevailing trend. Similarly, a true double bottom should form in a downtrend. Two equal lows in an uptrend represent a support test within a bull market, not a double bottom reversal.
What is the difference between a double top and a rectangle pattern?
A rectangle pattern features multiple tests of both support and resistance, creating a horizontal trading range, while a double top has specifically two tests of resistance followed by a breakdown. If price bounces between the same high and low levels three or more times, it becomes a rectangle rather than a double pattern. Rectangles can resolve in either direction, while a confirmed double top specifically signals a bearish resolution. The distinction matters because rectangles require a breakout in either direction for a trade signal, while double tops specifically anticipate a downside break.
Disclaimer
This is educational content, not financial advice. Trading involves risk, and you should consult a qualified financial advisor before making any investment decisions. Past performance does not guarantee future results.
12 chapters covering charts, indicators, risk management & more. Plus weekly trading insights.