Rising Wedge & Falling Wedge Patterns: How to Trade Them
⚡ Key Takeaways
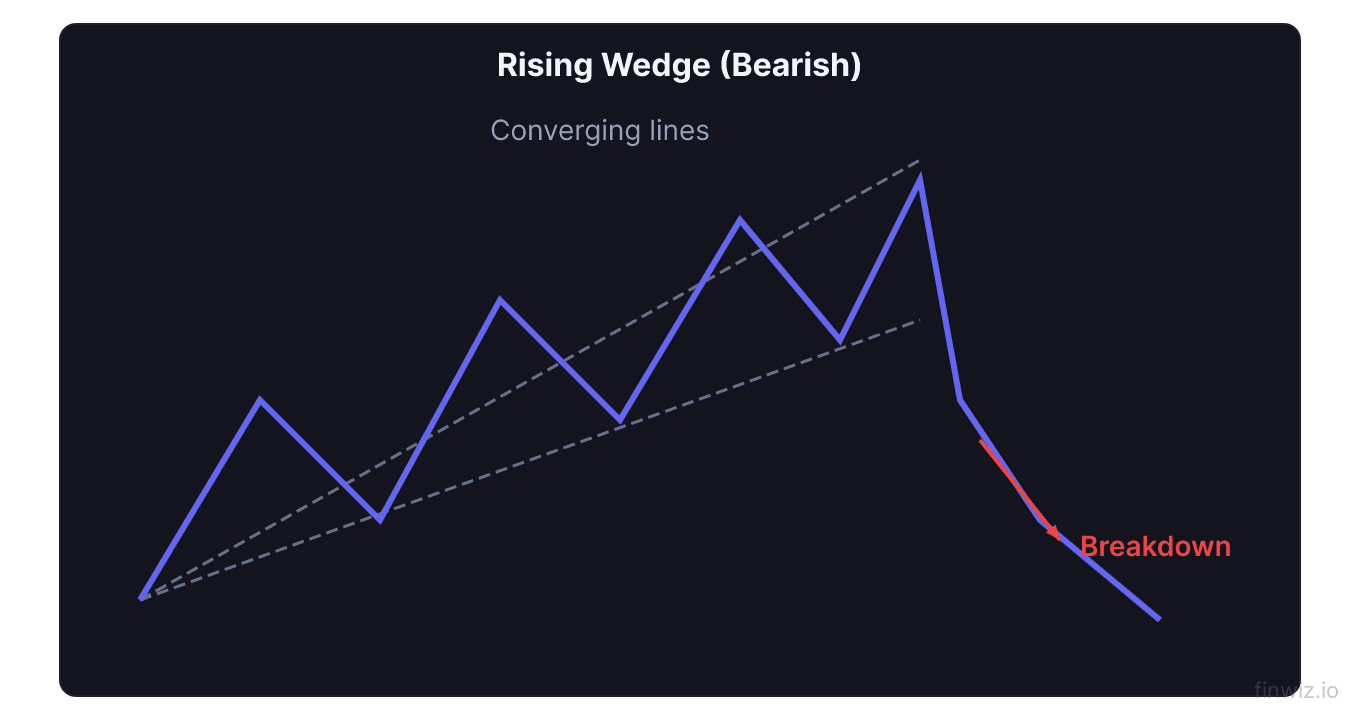
- A rising wedge is a bearish pattern with two upward-sloping, converging trendlines that signals weakening upward momentum and an impending breakdown.
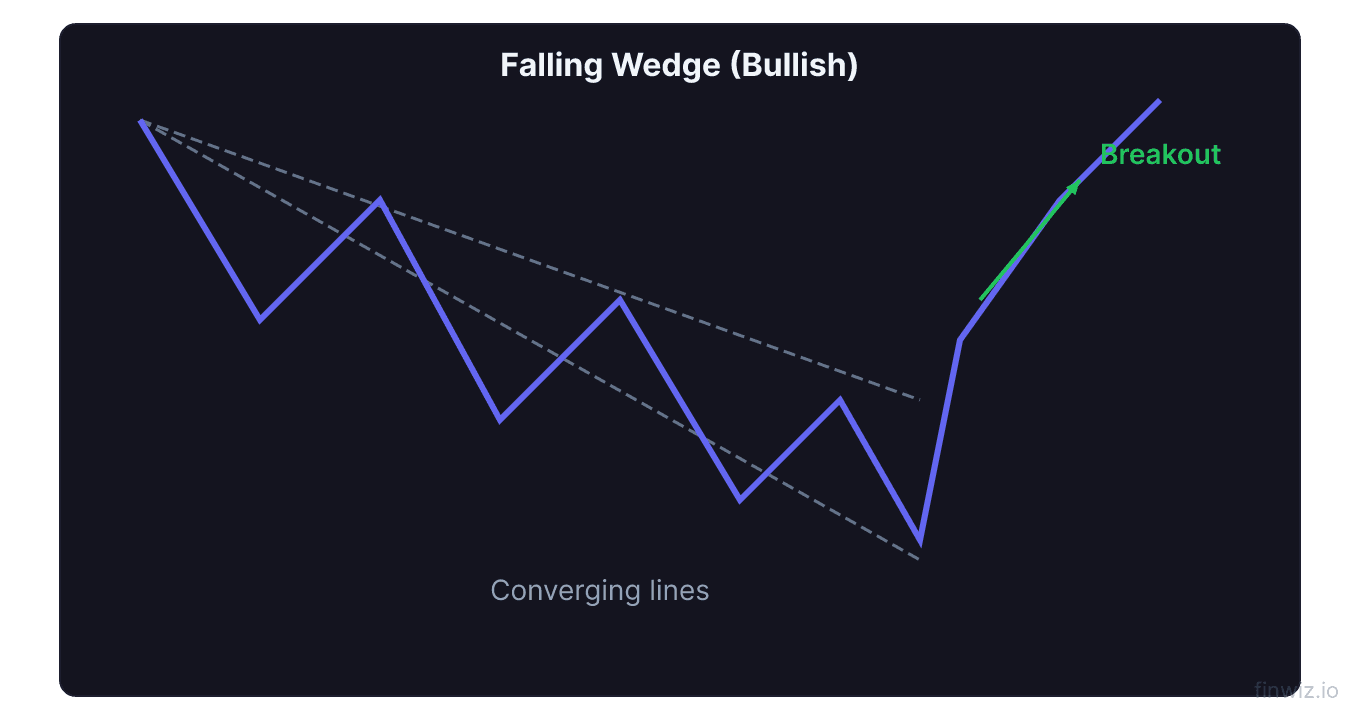
- A falling wedge is a bullish pattern with two downward-sloping, converging trendlines that signals diminishing selling pressure and an impending breakout.
- Both wedge patterns show narrowing price ranges and declining volume, indicating a loss of conviction in the prevailing direction.
- The measured move target equals the height of the widest part of the wedge projected from the breakout or breakdown point.
- Wedges can function as both continuation and reversal patterns depending on the trend context in which they appear.
What Are Wedge Patterns?
Wedge patterns are chart formations defined by two converging trendlines that both slope in the same direction. Unlike triangles, where one boundary is flat or the trendlines slope in opposite directions, wedge patterns have both trendlines moving the same way, either upward or downward, but at different angles.
There are two types of wedge patterns: the rising wedge (bearish) and the falling wedge (bullish). What makes wedges interesting and sometimes counterintuitive is that the pattern's directional signal is opposite to the direction the wedge points. A rising wedge, despite pointing upward, signals a bearish breakdown. A falling wedge, despite pointing downward, signals a bullish breakout.
Wedges work because they represent a progressive loss of momentum. In a rising wedge, each new high is incrementally smaller than the last, showing that buyers are running out of steam. In a falling wedge, each new low is incrementally shallower, showing that sellers are losing conviction.
The Rising Wedge
The rising wedge forms when price moves higher within two upward-sloping trendlines that converge toward each other. The lower trendline (support) rises more steeply than the upper trendline (resistance), causing the price range to narrow as the pattern develops.
Formation and Structure
Both the highs and lows within a rising wedge are increasing, which can be deceptive because higher highs and higher lows normally indicate a healthy uptrend. The critical difference is the rate of change: the highs are rising more slowly than the lows, compressing the price range and signaling that upward momentum is fading.
A valid rising wedge should have at least two touches on each trendline, though three or more touches create a more reliable pattern. The pattern typically takes several weeks to several months to develop on a daily chart.
Why It Is Bearish
The rising wedge is bearish because it shows that each successive rally is achieving less progress than the previous one. Buyers are pushing prices higher but with diminishing effectiveness. Meanwhile, sellers are finding it increasingly attractive to sell at each successive level, narrowing the range from above.
When the lower trendline (support) eventually breaks, the accumulated positions of buyers who entered during the pattern are immediately underwater, creating selling pressure as stops are triggered and confidence evaporates.
Volume in Rising Wedges
Volume should decline steadily during the formation of a rising wedge. This declining volume confirms the loss of buying enthusiasm. If volume is increasing within the wedge, the pattern's reliability decreases.
On the breakdown below the lower trendline, volume should expand noticeably. This volume surge confirms that selling pressure has overtaken buying interest and validates the bearish signal.
Pro Tip
Trading the Rising Wedge
The rising wedge offers clear trading rules for bearish positions.
Entry
Enter short (or exit long positions) when price closes below the lower trendline of the wedge on expanding volume. Some traders wait for a retest of the broken trendline from below before entering, which provides better risk-reward but may miss fast breakdowns.
Stop Loss
Place the stop above the most recent high within the wedge, or above the upper trendline. This level invalidates the pattern because it would mean the wedge is still intact and price could continue higher.
Price Target
Price Target = Breakdown Point - Wedge Height (at widest point)Measure the vertical distance at the widest part of the wedge (typically the starting point). Subtract this from the breakdown price. This represents the minimum expected decline.
Rising Wedge as Continuation vs. Reversal
When a rising wedge forms within a downtrend (as a counter-trend rally), it acts as a continuation pattern, with the breakdown resuming the prior downtrend. When it forms within an uptrend (at the end of a rally), it acts as a reversal pattern, signaling the end of the advance.
| Context | Type | Implication |
|---|---|---|
| Rising wedge in downtrend | Continuation | Resumes bearish trend |
| Rising wedge in uptrend | Reversal | Ends bullish trend |
| Falling wedge in uptrend | Continuation | Resumes bullish trend |
| Falling wedge in downtrend | Reversal | Ends bearish trend |
The Falling Wedge
The falling wedge forms when price moves lower within two downward-sloping trendlines that converge. The upper trendline (resistance) falls more steeply than the lower trendline (support), narrowing the price range as the pattern progresses.
Formation and Structure
Both highs and lows within the falling wedge are decreasing, which can mislead traders into thinking the downtrend will continue. However, the rate of decline in the highs is faster than in the lows, indicating that selling momentum is weakening. Each new low is only marginally lower than the previous one, showing that sellers are losing their ability to push prices significantly lower.
Like the rising wedge, a valid falling wedge needs at least two touches on each trendline. The pattern develops over several weeks to months on a daily chart.
Why It Is Bullish
The falling wedge is bullish because it demonstrates diminishing selling pressure. Each successive decline makes less downward progress, while the converging trendlines create a compression that eventually resolves with an upside breakout.
When the upper trendline (resistance) breaks, short sellers who entered during the pattern are caught in losing positions. Their buying to cover shorts combines with new long entries to produce a sharp rally.
Volume in Falling Wedges
Volume should contract during the falling wedge formation, reflecting the declining momentum in both directions. The narrowing price range and falling volume create a coiled-spring effect.
On the breakout above the upper trendline, volume should expand substantially. Strong volume on the breakout confirms that demand has overwhelmed supply and that the bullish reversal is genuine.
Trading the Falling Wedge
Entry
Buy when price closes above the upper trendline of the falling wedge on strong volume. Alternatively, wait for a pullback to the broken trendline (now acting as support) for a higher-probability entry with tighter risk.
Stop Loss
Place the stop below the most recent low within the wedge, or below the lower trendline at the point of the breakout. If price falls back below the wedge structure, the bullish thesis is invalidated.
Price Target
Price Target = Breakout Point + Wedge Height (at widest point)Measure the height of the wedge at its widest point and add this distance to the breakout price for the minimum expected advance.
Pro Tip
Rising Wedge vs. Ascending Triangle
Traders sometimes confuse rising wedges with ascending triangles because both involve rising lows. The critical difference is the upper boundary.
An ascending triangle has a flat upper boundary (horizontal resistance), while a rising wedge has an upward-sloping upper boundary. This difference creates opposite implications: the ascending triangle is bullish (buyers pushing against fixed resistance), while the rising wedge is bearish (narrowing momentum despite rising prices).
If both trendlines slope upward and converge, it is a rising wedge. If the upper boundary is flat and the lower boundary rises, it is an ascending triangle. Correctly identifying which pattern you are observing is essential because trading them requires opposite directional biases.
Falling Wedge vs. Descending Triangle
Similarly, falling wedges are sometimes confused with descending triangles. The descending triangle has a flat lower boundary (horizontal support), while the falling wedge has a downward-sloping lower boundary.
The descending triangle is bearish (sellers pushing against fixed support), while the falling wedge is bullish (diminishing selling pressure despite falling prices). If both trendlines slope downward and converge, it is a falling wedge. If the lower boundary is flat and the upper boundary declines, it is a descending triangle.
Wedge Patterns in Real Markets
Several practical considerations affect how wedges behave in different market conditions.
Timeframe significance. Wedges on weekly and daily charts produce the most reliable signals. Intraday wedges can be traded but have higher failure rates. A rising wedge on a weekly chart that has developed over several months carries far more weight than one on a 15-minute chart.
Market conditions. Rising wedges perform best (break down most reliably) in markets that are transitioning from bullish to bearish. Falling wedges perform best (break out most reliably) in markets that are transitioning from bearish to bullish. In strongly trending markets, wedges that form against the trend may take longer to resolve.
Sector analysis. If multiple stocks in a sector are forming similar wedge patterns, the directional implication is strengthened. Sector-wide rising wedges during a market top are a powerful warning sign.
Common Mistakes with Wedge Patterns
Avoid these errors to improve your wedge trading.
Confusing wedges with channels. A wedge has converging trendlines; a channel has parallel trendlines. Channels do not carry the same momentum-loss implications as wedges. If the trendlines are roughly parallel rather than converging, you are looking at a channel, not a wedge.
Trading before the breakout/breakdown. While it is tempting to anticipate the breakout direction (especially since wedges have a clear directional bias), the safest approach is to wait for the trendline break on volume. Premature entries risk being caught in a pattern that takes longer than expected to resolve.
Ignoring the trend context. A rising wedge within a strong bull market may take much longer to break down than one in a neutral or bearish environment. Context determines how aggressively you should trade the signal.
Using wrong position sizing. Because wedge breakdowns and breakouts can be sharp, proper position sizing based on the distance to your stop is critical. Do not over-leverage on wedge trades, as false breakouts can occur.
Advanced Wedge Trading Strategies
Experienced traders use several advanced approaches with wedge patterns.
Combining with Fibonacci levels. If the breakdown from a rising wedge targets a key Fibonacci retracement level from the prior advance, the confluence adds to the target's significance. Similarly, falling wedge breakouts that target Fibonacci extension levels provide enhanced targets.
Using MACD for timing. MACD crossovers that occur near the apex of the wedge can provide excellent timing signals for the breakout or breakdown. A MACD sell signal near the end of a rising wedge, or a buy signal near the end of a falling wedge, adds confirmation.
Multiple timeframe analysis. Identify the wedge on a higher timeframe (daily or weekly) and use a lower timeframe (4-hour or 1-hour) to fine-tune your entry. This approach allows for tighter stops while trading a higher-timeframe pattern.
Pairing with candlestick patterns. Look for bearish engulfing patterns at the upper trendline of a rising wedge, or bullish hammer candlesticks at the lower trendline of a falling wedge. These candle signals can provide early entry triggers within the wedge structure.
Frequently Asked Questions
What is the success rate of wedge patterns?
Rising wedges have a breakdown success rate of approximately 65-70%, while falling wedges have a breakout success rate of about 65-70%. These rates improve significantly when the pattern is confirmed with proper volume behavior (declining volume during formation, expanding volume on the break). Adding indicator confirmation such as RSI divergence or MACD crossovers can push success rates even higher. However, no pattern works 100% of the time, which is why stop losses are essential.
How long do wedge patterns take to form?
On a daily chart, wedges typically take 3 weeks to 6 months to form. Shorter wedges (under 3 weeks) may lack sufficient data points for reliable trendlines. Longer wedges (over 6 months) are significant but may test traders' patience. The pattern should ideally have at least 5-6 bounces between the two trendlines before breaking out or breaking down. On weekly charts, wedges can take months to over a year to fully develop.
Can a rising wedge break upward?
Yes, approximately 30-35% of rising wedges break upward instead of downward. When this happens, the move can be powerful as it catches bearish traders off guard. However, upward breaks from rising wedges are less reliable than the expected downward break, and many upward breaks eventually fail and reverse downward. If a rising wedge breaks upward, it is wise to require strong volume confirmation and watch for signs of a false breakout before committing to a long position.
What is the difference between a wedge and a triangle?
The main difference is the direction of the trendlines. In a wedge, both trendlines slope in the same direction (both up in a rising wedge, both down in a falling wedge). In a symmetrical triangle, one trendline slopes up and the other slopes down. In an ascending triangle, one line is flat (resistance) and the other rises. In a descending triangle, one line is flat (support) and the other falls. This structural difference creates different momentum implications: wedges signal momentum loss in the direction they point, while triangles signal consolidation with varying directional biases.
Should I trade wedges in both directions?
Most traders focus on the primary directional bias: shorting the breakdown from rising wedges and buying the breakout from falling wedges. Trading the counter-directional move (buying a rising wedge upside break or shorting a falling wedge downside break) is generally lower probability and should only be attempted by experienced traders with strict risk management. Stick with the pattern's primary signal until you have extensive experience with wedge formations.
Disclaimer
This is educational content, not financial advice. Trading involves risk, and you should consult a qualified financial advisor before making any investment decisions. Past performance does not guarantee future results.
12 chapters covering charts, indicators, risk management & more. Plus weekly trading insights.