Morning Star & Evening Star: Three-Candle Reversal Patterns
⚡ Key Takeaways
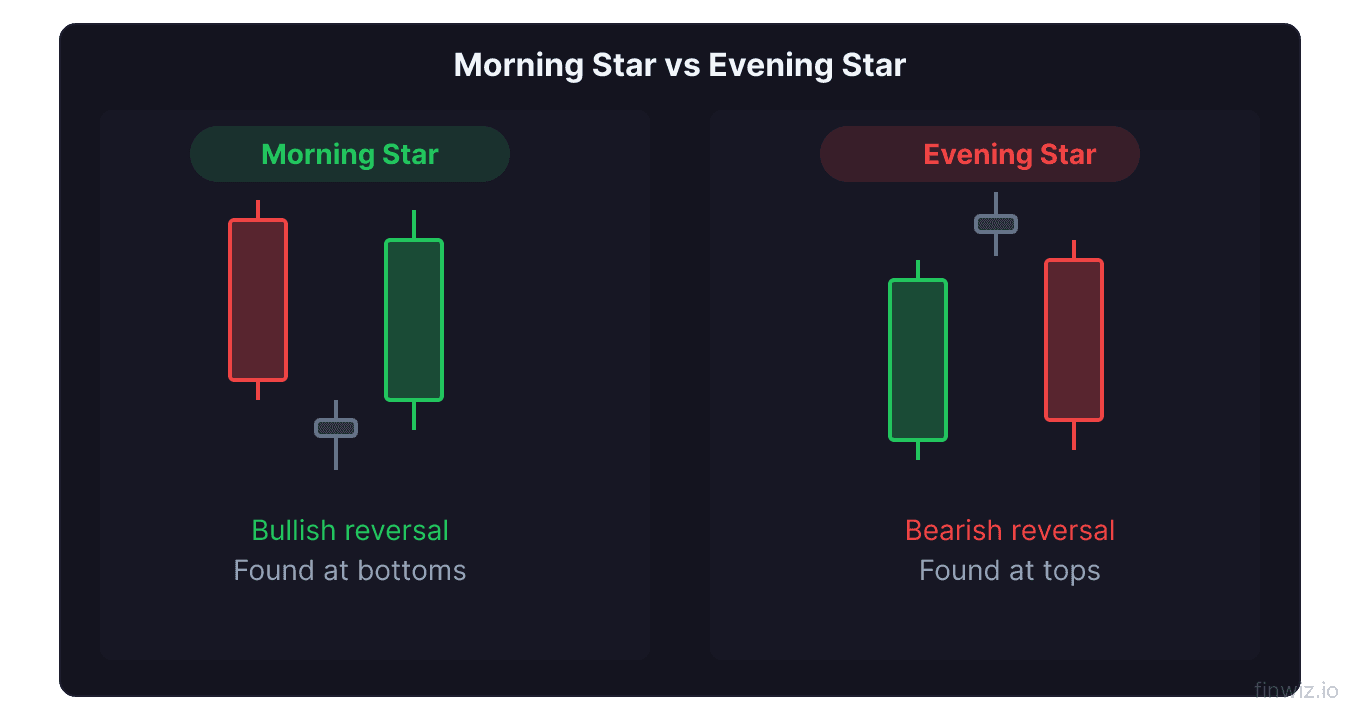
- The morning star is a three-candle bullish reversal pattern that forms at the bottom of a downtrend, signaling a shift from bearish to bullish momentum.
- The evening star is a three-candle bearish reversal pattern that forms at the top of an uptrend, warning of an impending decline.
- Both patterns feature a transitional middle candle (the star) that shows indecision between the opposing directional candles.
- Volume should decrease on the middle candle and increase on the third candle to confirm the reversal.
- These patterns are most reliable when the star candle is a doji and the pattern forms at a significant support or resistance level.
What Are Morning Star and Evening Star Patterns?
The morning star and evening star are three-candle reversal patterns that rank among the most reliable formations in candlestick analysis. Named after the celestial bodies that appear just before sunrise and sunset, these patterns signal the end of one trend and the beginning of another.
The morning star appears at the bottom of a downtrend, heralding the arrival of bullish momentum like the morning star (Venus) announces the coming sunrise. The evening star appears at the top of an uptrend, warning of an impending decline like the evening star signals the approaching night.
What makes these patterns particularly powerful is their three-candle structure, which maps the complete psychology of a trend reversal: the old trend, the moment of indecision, and the new trend. This narrative quality gives traders a clear visual story of how and why the market shifted direction.
Structure of the Morning Star
The morning star consists of three specific candles that must appear in sequence during a downtrend.
First Candle: The Bearish Candle
The first candle is a long-bodied bearish (red) candle that continues the prevailing downtrend. It should have a substantial real body, confirming that sellers remain firmly in control. This candle sets the stage by demonstrating the strength of the existing bearish trend.
Second Candle: The Star
The second candle is a small-bodied candle that ideally gaps down from the first candle's close. This is the "star" of the pattern. The small body can be either bullish or bearish; what matters is that it is significantly smaller than the first candle's body.
The star represents the critical transition point. Sellers pushed the price down at the open (hence the gap), but they could not sustain the decline. By the close, the session's range is narrow, showing that the selling momentum has stalled. This is the moment of equilibrium between bears and bulls.
When the star is a doji, the pattern is called a morning doji star and is considered even more significant because the doji represents a complete state of indecision.
Third Candle: The Bullish Confirmation
The third candle is a long-bodied bullish (green) candle that ideally gaps up from the star and closes above the midpoint of the first candle's body. This candle confirms the reversal by demonstrating that buyers have seized control.
The third candle should close at least halfway up the first candle's body. The higher the close relative to the first candle, the stronger the reversal signal. A third candle that closes above the first candle's open provides the strongest possible confirmation.
Pro Tip
Structure of the Evening Star
The evening star is the bearish mirror image of the morning star, appearing during an uptrend.
First Candle: The Bullish Candle
A long-bodied bullish (green) candle continues the uptrend. Its substantial size confirms strong buyer control.
Second Candle: The Star
A small-bodied candle that ideally gaps up from the first candle's close. The narrow range shows that buying momentum has stalled at the highs. When this candle is a doji, the pattern is called an evening doji star.
Third Candle: The Bearish Confirmation
A long-bodied bearish (red) candle that ideally gaps down from the star and closes below the midpoint of the first candle's body. This confirms that sellers have taken control and the uptrend is reversing.
| Component | Morning Star | Evening Star |
|---|---|---|
| Trend | Downtrend | Uptrend |
| First Candle | Long bearish | Long bullish |
| Star | Small body, gaps down | Small body, gaps up |
| Third Candle | Long bullish | Long bearish |
| Signal | Bullish reversal | Bearish reversal |
| Confirmation | Close above 1st candle midpoint | Close below 1st candle midpoint |
Volume Analysis
Volume confirms the validity of morning star and evening star patterns.
First candle volume: Should be moderate to high, consistent with the prevailing trend.
Star volume: Should be lower than the first candle. The declining volume at the turning point reflects the pause in momentum. If volume is high on the star, it may indicate a continuation move rather than a reversal.
Third candle volume: Should be the highest of the three candles. This volume surge confirms that the new direction has strong participation behind it. The contrast between the low-volume star and the high-volume third candle powerfully illustrates the shift from indecision to conviction.
In the morning star, increasing volume on the third (bullish) candle shows that buyers are entering aggressively. In the evening star, increasing volume on the third (bearish) candle shows that sellers are pressing hard.
Trading the Morning Star
Entry
Standard entry: Buy at the close of the third candle or at the open of the next session. By this point, the pattern is complete and the reversal is confirmed.
Aggressive entry: Some traders enter during the third candle's session when it becomes clear that a strong bullish candle is forming. This provides a better price but carries the risk that the candle's close may not meet the pattern's confirmation criteria.
Stop Loss
Place the stop below the lowest point of the pattern, which is typically the low of the star candle or the low of the first candle, whichever is lower. This level represents the extreme of selling pressure during the reversal formation.
Price Target
Several target methods apply:
- Resistance level: The nearest overhead resistance from the prior decline
- Measured move: The height of the first candle projected upward from the third candle's close
- Fibonacci extension: Extensions based on the low of the star to the close of the third candle
- Moving average target: A declining moving average that price is likely to test during the recovery
Trading the Evening Star
Entry
Sell short at the close of the third candle or at the open of the next session. The complete pattern confirms the bearish reversal.
Stop Loss
Place the stop above the highest point of the pattern (typically the high of the star candle). If price exceeds the star's high, the reversal has failed and the uptrend may continue.
Price Target
Use the nearest support level, a measured move equal to the first candle's length projected downward, or Fibonacci levels from the prior advance.
Pro Tip
Morning Star and Evening Star Variations
Several variations of these patterns appear in real markets.
Doji Star Variants
When the star candle is a doji, the morning doji star or evening doji star is formed. These variants are considered more significant because the doji represents a complete state of indecision at the turning point. The contrast between the strong first candle, the indecisive doji, and the strong reversal candle creates a compelling narrative of trend exhaustion and reversal.
Abandoned Baby
The abandoned baby is a rare and powerful variant where the star candle (usually a doji) gaps completely away from both the first and third candles. In a bullish abandoned baby, the doji gaps below both neighboring candles. In a bearish abandoned baby, the doji gaps above both neighbors. The doji is "abandoned" in a gap, completely separated from the surrounding price action. This pattern is extremely rare but highly reliable.
Three-Candle Patterns Without Gaps
In markets that trade continuously (forex, crypto), true gaps between the candles are uncommon. The morning star and evening star can still be valid without gaps, as long as the bodies of the three candles show the correct relative sizes and the star is clearly smaller than the other two. The absence of gaps slightly reduces the pattern's reliability but does not invalidate it.
Where Morning Stars and Evening Stars Work Best
Location on the chart dramatically affects the reliability of these patterns.
At major support (morning star): A morning star that forms at a well-established support level, prior swing low, or significant Fibonacci retracement combines the three-candle reversal with a known demand zone. This confluence significantly increases the probability of a sustained rally.
At major resistance (evening star): An evening star at resistance, a prior swing high, or a Fibonacci extension level combines the reversal pattern with a known supply zone.
At moving averages: Morning stars at the rising 200-day moving average or evening stars at a declining moving average gain additional significance from these dynamic support and resistance levels.
After extended trends: The longer and more extended the preceding trend, the more significant the reversal pattern. A morning star after a 30% decline is more meaningful than one after a 5% pullback.
Morning Star and Evening Star vs. Other Reversal Patterns
How do these three-candle patterns compare to other reversal formations?
vs. Engulfing Patterns
Engulfing patterns are two-candle formations that show an abrupt reversal. The morning and evening star are three-candle formations that show a more gradual transition through indecision. Both are effective, but the three-candle structure provides an additional data point (the star) that can increase confidence in the reversal. Engulfing patterns provide faster signals; star patterns provide more thorough confirmation.
vs. Hammer and Shooting Star
The hammer and shooting star are single-candle patterns that require external confirmation. The morning and evening star are self-contained three-candle patterns with built-in confirmation (the third candle). The three-candle structure is generally considered more reliable because it shows the complete reversal process rather than relying on the following session to confirm.
vs. Head and Shoulders
The head and shoulders is a larger structural pattern that takes weeks or months to form, while the morning and evening star forms over just three sessions. Both signal reversals, but they operate on different timescales. The head and shoulders is a macro pattern; the star patterns are micro patterns. They can complement each other when a morning or evening star forms at a critical point within a head and shoulders formation.
Risk Management for Star Pattern Trades
Disciplined risk management ensures that failed patterns do not devastate your account.
Position sizing: Calculate the distance from your entry to your stop (below the pattern low for morning stars, above the pattern high for evening stars). Determine the position size that keeps total dollar risk within 1-2% of your account value.
Partial profit strategy: Take 50% of your position off at a 1:1 risk-reward ratio, then trail the remaining 50% with a moving average or behind swing lows/highs. This approach secures early profits while allowing the winning portion to capture a larger move.
Time-based exits: If the reversal does not produce meaningful follow-through within 3-5 sessions after the pattern completes, consider reducing the position. Strong morning and evening star reversals typically show immediate follow-through. A lack of follow-through may indicate that the pattern will ultimately fail.
Star Patterns in Different Markets
These patterns appear across all markets with varying characteristics.
In stocks, morning and evening stars are most effective because the overnight gaps between sessions create the separations between candles that define the pattern. Earnings-related star patterns (where the star forms on the earnings reaction day) can signal powerful reversals.
In forex, the continuous trading session means gaps are rare. Look for clear body separations rather than true gaps. Star patterns on the daily forex chart are still effective, particularly at major round-number levels and central bank policy levels.
In cryptocurrency, extreme volatility can produce dramatic star patterns. The large candle bodies and wicks typical of crypto create visually impressive formations, but the higher volatility requires wider stops and adjusted expectations.
Frequently Asked Questions
How reliable are morning star and evening star patterns?
Morning star and evening star patterns are among the most reliable candlestick formations, with estimated success rates of 65-75% when properly confirmed with volume and formed at significant support or resistance levels. The morning doji star and evening doji star variants may be slightly more reliable due to the complete indecision represented by the doji. As with all patterns, success rates improve with proper context (trend, level, volume, indicators) and decline in choppy or trendless markets.
Does the star candle have to gap away from the first and third candles?
In stocks, gaps between the candles are ideal and strengthen the pattern. However, in continuously traded markets like forex and crypto, true gaps are rare. The pattern is still valid without gaps as long as the star candle's body is clearly separated from and smaller than the bodies of the first and third candles. The key is the relative size and positioning of the three bodies, not the presence of gaps. A strict requirement for gaps would eliminate most star patterns in forex and crypto.
Can the star candle be a different color than expected?
Yes, the color of the star candle is less important than its size and position. The star can be bullish, bearish, or a doji. What matters is that its body is small relative to the first and third candles, indicating indecision at the turning point. The third candle's color and size are far more important: it must clearly signal the new direction (bullish for morning star, bearish for evening star) and close beyond the midpoint of the first candle's body.
How far should the third candle close into the first candle's body?
The standard requirement is that the third candle should close above (morning star) or below (evening star) the midpoint of the first candle's body. The further the third candle penetrates into the first candle's body, the stronger the signal. A third candle that closes beyond the first candle's open provides the most powerful confirmation possible. If the third candle barely reaches the midpoint, the signal is weaker and additional confirmation from volume or the next session's price action becomes more important.
Can I trade the morning star in forex markets that have no gaps?
Absolutely. While the textbook morning star features gaps between the three candles, the pattern works well in forex markets without strict gaps. Focus on the essential characteristics: a long bearish first candle, a small-bodied second candle, and a long bullish third candle that closes well into the first candle's body. Volume (tick volume in forex) should support the pattern, with decreasing volume on the star and increasing volume on the third candle. Many successful forex traders regularly trade gap-less morning and evening star patterns on the daily and 4-hour charts.
Disclaimer
This is educational content, not financial advice. Trading involves risk, and you should consult a qualified financial advisor before making any investment decisions. Past performance does not guarantee future results.
12 chapters covering charts, indicators, risk management & more. Plus weekly trading insights.