VCP Pattern (Volatility Contraction): Mark Minervini's Setup
⚡ Key Takeaways
- The VCP (Volatility Contraction Pattern) is a base-building formation where each successive contraction within the base gets tighter, signaling diminishing selling pressure before a breakout.
- Mark Minervini, a U.S. Investing Champion, developed the VCP framework as a systematic method for identifying institutional accumulation in leading growth stocks.
- A valid VCP requires progressively tightening pivots — each pullback within the base should be shallower than the previous one — and volume dry-up as the pattern matures.
- The entry trigger is a breakout above the pivot point (the high of the final, tightest contraction) on a surge in volume.
What Is the VCP Pattern?
The Volatility Contraction Pattern (VCP) is a basing structure that identifies stocks transitioning from distribution (selling pressure) to accumulation (buying pressure) through a series of progressively smaller price contractions. Each contraction represents a wave of sellers being absorbed, until supply is exhausted and the stock is ready to advance.
Mark Minervini formalized the VCP in his books Trade Like a Stock Market Wizard and Think & Trade Like a Champion. Minervini won the U.S. Investing Championship with a 155% annual return and credits the VCP as a cornerstone of his entry methodology.
The VCP is not just a chart pattern — it is a visual representation of supply and demand mechanics. Each tightening contraction shows fewer sellers willing to part with shares at current prices. When the final contraction produces minimal price range on minimal volume, the remaining float is in strong hands, and any demand catalyst can push the stock sharply higher.
VCP Structure and Criteria
A textbook VCP contains 2-5 contractions within a larger base, with each contraction meeting specific criteria.
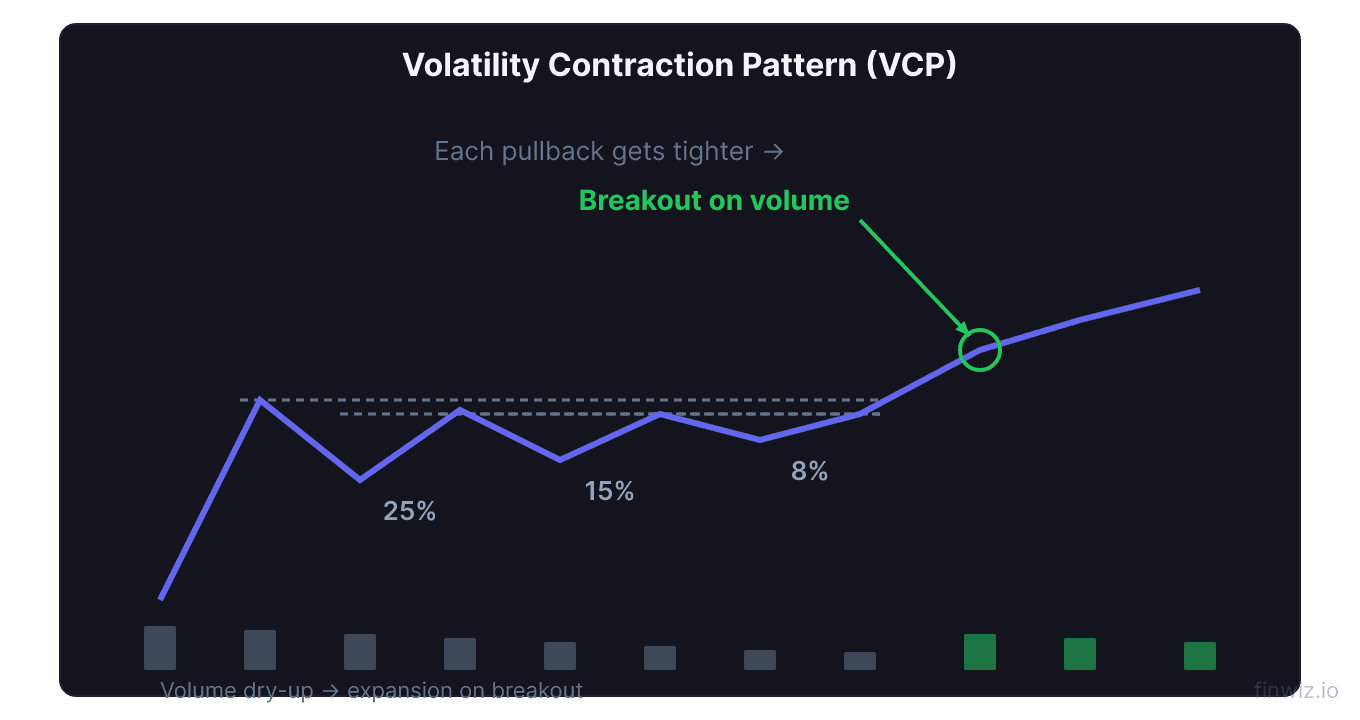
Contraction depth decreases. The first pullback within the base might be 25-30%. The second pullback narrows to 15%. The third tightens to 8%. The fourth compresses to 3-4%. This progressive tightening is the defining characteristic. If contractions are random or widening, it is not a VCP.
Volume dries up. As contractions tighten, volume should decline significantly. The lowest-volume bars in the pattern should appear during the final, tightest contraction. This dry-up confirms that sellers are exhausted — there is simply no one left willing to sell at this level.
Price holds above the 200-day moving average. Minervini's criteria require the stock to be in a Stage 2 uptrend (above its 200-day MA with the MA sloping upward). A VCP forming below the 200-day MA is a base within a downtrend — a fundamentally different and weaker setup.
Relative strength. The stock should outperform the market during the basing period. Even while consolidating, a VCP candidate should hold up better than the S&P 500 on down days. This relative strength confirms institutional support.
VCP Contraction Sequence Example:Identifying the Pivot Point
The pivot point is the specific price level where the VCP breakout triggers a buy. It sits at the high of the last, tightest contraction within the base.
Identifying the pivot correctly is critical. Set it too low (inside the base) and you buy before the pattern confirms. Set it too high (above the base) and you miss the optimal entry or chase the move.
On a stock like CRWD, a VCP that formed in its 2023 consolidation showed contractions narrowing from 18% to 9% to 4%. The pivot was at the high of that final 4% contraction. The breakout above the pivot on 2x average volume confirmed the pattern and led to a sustained advance.
The pivot should be a clean, identifiable level — not a vague zone. Draw a horizontal line at the exact high of the final contraction. Your buy order goes slightly above that line (typically $0.10-$0.50 above to confirm the breakout).
Entry and Risk Management
Entry: Buy when price breaks above the pivot point on volume that is at least 40-50% above the 50-day average volume. Volume confirmation is non-negotiable. A breakout on weak volume is suspect and frequently fails.
Stop loss: Place your stop 3-7% below the entry price, or just below the low of the final contraction. Because the VCP's tightest contraction produces a narrow range, the stop is close to the entry — this tight risk is one of the pattern's greatest advantages.
Position sizing: With a tight stop, you can size the position larger while keeping dollar risk constant. If your risk per trade is $500 and the stop is 4% below entry, you can take a larger share count than a pattern requiring a 10% stop.
Profit targets: Minervini recommends trailing the position with a rising moving average (10 or 21 EMA) rather than setting fixed targets. Growth stocks that break out of VCPs can run 30-100%+ in trending markets. Fixed targets leave too much on the table.
Pro Tip
VCP vs. Other Base Patterns
The VCP shares characteristics with other consolidation patterns but has distinct differences.
VCP vs. Cup and Handle. The cup and handle has a single rounded base (cup) followed by a single shallow pullback (handle). The VCP can have multiple contractions — it is a more granular breakdown of supply absorption. Many handles are actually small VCPs forming within a larger cup base.
VCP vs. Bull Flag. A bull flag is a short pause within a steep advance — it lasts days to a few weeks. A VCP base takes weeks to months to develop. The VCP represents a deeper, more thorough process of supply absorption than a flag, which is merely a momentary breath in an impulse move.
VCP vs. Consolidation Patterns. Not all consolidations are VCPs. The defining difference is the progressive tightening. A stock trading in a $10 range for three months without narrowing is a rectangular consolidation, not a VCP. The VCP requires visible, measurable contraction compression.
Real-World VCP Examples
NVDA (2023). After its massive AI-driven advance, NVDA built a multi-month VCP base. The contractions narrowed from roughly 20% to 10% to 5%, with volume declining steadily. The breakout from the pivot triggered a move that added another 50%+ over the following months.
AAPL (various cycles). Apple has formed VCPs at multiple points during its long-term uptrend. The 2019-2020 base before its pandemic-era rally showed classic contraction tightening from 12% to 6% to 3%, with volume drying up at the pivot before a breakout to new highs.
The pattern repeats across market cycles because it reflects a universal dynamic: institutional accumulation creates a floor, selling waves diminish, and the stock eventually breaks free when the last weak holders have been shaken out.
Common VCP Mistakes
Buying before the pivot breaks. Anticipating the breakout negates the pattern's confirmation mechanism. The pivot exists precisely to tell you when supply has been absorbed. Without the breakout, you are guessing.
Ignoring volume. A breakout on below-average volume is a trap. Without volume confirmation, the breakout lacks the institutional participation needed to sustain the move. Wait for volume or pass on the trade.
Forcing contractions. Not every pullback within a base represents a VCP contraction. The tightening must be clear and measurable. If you have to squint or rationalize why the pattern is a VCP, it probably is not one.
Trading VCPs in weak markets. Minervini emphasizes that the market direction (the "M" in his methodology) must be favorable. VCP breakouts fail at much higher rates when the S&P 500 is in a downtrend. Wait for a confirmed uptrending market before acting on VCP setups.
Frequently Asked Questions
How long does a VCP take to form?
Most VCPs develop over 3 weeks to 6 months. Shorter bases (under 3 weeks) typically have not absorbed enough supply for a reliable breakout. Longer bases (6+ months) are valid but require patience. The duration depends on how much distribution occurred during the prior advance and how aggressively institutions are accumulating during the base.
What win rate can I expect trading VCPs?
Minervini reports that properly filtered VCPs produce a win rate of roughly 50-60%, but the key is the reward-to-risk ratio. Because stops are tight (3-7%) and winners can run 20-100%+, the expectancy is strongly positive even with a modest hit rate. The VCP is not a high-accuracy pattern — it is a high-expectancy pattern.
Can VCPs form in downtrending stocks?
Technically, contraction sequences can appear in downtrending stocks, but Minervini's framework explicitly excludes them. A VCP in a stock below its 200-day moving average is a bearish consolidation, not a launchpad. The VCP's power comes from catching stocks in Stage 2 uptrends where the contraction represents a pause before continuation, not a pause before further decline.
12 chapters covering charts, indicators, risk management & more. Plus weekly trading insights.