Hanging Man Candlestick: Bearish Reversal at the Top
⚡ Key Takeaways
- The hanging man is a bearish reversal candlestick pattern that appears at the top of an uptrend, featuring a small body near the session high and a long lower shadow at least twice the body
- s body) is required before acting on the signal.
- The hanging man works best when it appears at established resistance levels, overbought RSI readings, or after extended rallies with diminishing momentum.
What Is a Hanging Man Candlestick?
The hanging man is a single-candle bearish reversal pattern that forms at the peak of an uptrend or a significant rally. It warns traders that the bulls may be losing control and that a reversal or pullback could be imminent.
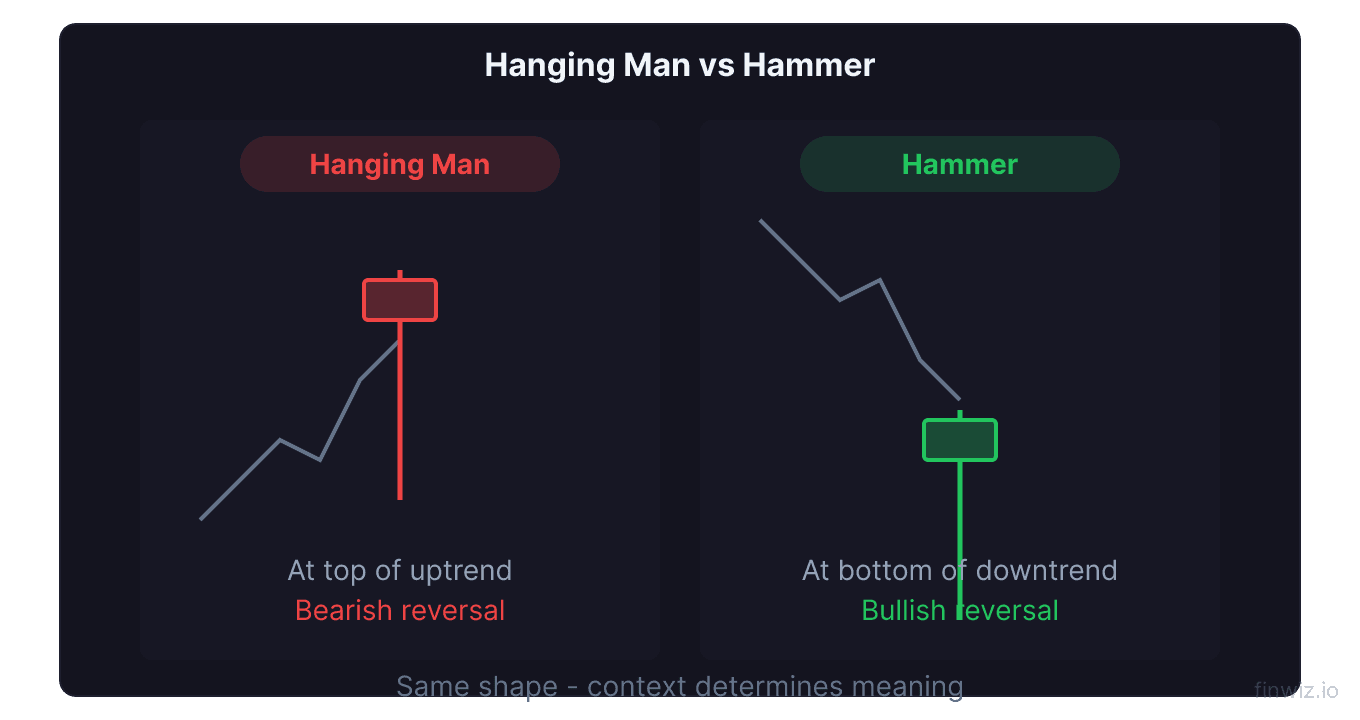
Visually, the hanging man looks exactly like a hammer candlestick. It has a small real body near the top of the candle's range, little to no upper shadow, and a long lower shadow that extends at least two times the length of the body. The critical difference is location: a hammer appears at the bottom of a downtrend and signals bullish reversal, while the hanging man appears at the top of an uptrend and signals bearish reversal.
The name evokes the image of a person hanging by the neck, with the long lower shadow representing dangling legs. It is a grim metaphor, but it effectively captures the pattern's warning: the uptrend may be about to die.
Anatomy of the Hanging Man
Understanding the precise structure helps you identify the pattern correctly and distinguish it from look-alike candles.
Real Body
The real body is small and sits near the upper end of the candle's total range. The body can be either bullish (green) or bearish (red). A red (bearish close) hanging man is considered slightly more potent because it shows sellers managed to push the close below the open, reinforcing the bearish narrative. However, both colors are valid.
Lower Shadow
The lower shadow is the pattern's defining feature. It must extend at least twice the length of the real body. The strongest hanging man candles have lower shadows three to four times the body length. This long wick reveals that sellers drove prices sharply lower during the session before buyers managed to recover most of the lost ground.
Upper Shadow
Ideally, the hanging man has little to no upper shadow. A small upper wick is acceptable, but a substantial upper shadow transforms the candle into a spinning top or high-wave candle, which carries different implications.
Pro Tip
Why the Hanging Man Signals Bearish Reversal
The psychology behind the hanging man is a story of shifting power dynamics between bulls and bears.
During an established uptrend, the market opens and at some point during the session, aggressive selling drives the price sharply lower. This is unusual behavior in an uptrend and suggests that either profit-taking has intensified or new short sellers are entering the market.
By the close, buyers manage to rally the price back near the session's high. On the surface, this looks like bulls are still in control. But the damage has been done: the long lower shadow reveals that sellers now have the power to move prices significantly. The equilibrium is shifting.
If the next session confirms the bearish signal with a lower close, it validates the concern. The bulls who bought the dip during the hanging man session are now underwater, adding sell pressure as they exit losing positions.
Hanging Man vs. Hammer: Understanding the Difference
Since the hanging man and hammer share identical shapes, traders must rely entirely on context to classify them correctly.
| Feature | Hanging Man | Hammer |
|---|---|---|
| Shape | Small body, long lower wick | Small body, long lower wick |
| Trend Context | Appears after an uptrend | Appears after a downtrend |
| Signal | Bearish reversal | Bullish reversal |
| Psychology | Sellers emerging at tops | Buyers emerging at bottoms |
| Confirmation | Bearish candle follows | Bullish candle follows |
| Preferred Body Color | Red (bearish) slightly stronger | Green (bullish) slightly stronger |
The key lesson is that candlestick patterns derive meaning from context, not from shape alone. A candle that appears identical can carry opposite implications depending on where it forms in the broader trend structure.
Volume Confirmation for the Hanging Man
Volume analysis dramatically improves the reliability of the hanging man pattern. Without volume confirmation, the pattern's accuracy drops significantly.
High volume during the hanging man session is a critical warning sign. It tells you that the sell-off during the session was driven by heavy participation, not just a few panicked sellers. When institutional traders or large market participants begin distributing shares near a top, volume typically spikes.
Low volume hanging man candles are far less reliable. The intra-session sell-off may have been caused by a temporary liquidity gap rather than genuine distribution. Low-volume hanging man candles should be treated with skepticism.
Compare the hanging man's volume to the 20-day average volume. A hanging man with volume 1.5 times or more above the 20-day average is a strong warning signal. For additional volume analysis, consider using the On-Balance Volume or Accumulation/Distribution line to confirm whether distribution is occurring.
Pro Tip
Trading the Hanging Man Pattern
The hanging man provides a structured framework for bearish trade setups at market tops.
Waiting for Confirmation
Never act on a hanging man candle alone. The single most important rule is waiting for bearish confirmation on the following session. A valid confirmation candle closes below the hanging man's real body, and ideally below the hanging man's low.
Without confirmation, the hanging man may simply be a pause within a continuing uptrend. Many hanging man candles fail to produce reversals, especially in strong bull markets. Confirmation filters out the noise.
Entry Strategies
Standard short entry: Enter a short position on the close of the confirmation candle (the bearish candle following the hanging man). This approach sacrifices some profit potential but significantly reduces false signal risk.
Break-of-low entry: Wait for price to break below the hanging man's low. This provides extra confirmation that selling pressure has overcome the session's support zone. Place the entry order just below the hanging man's low.
Aggressive entry: Enter short at the close of the hanging man session before confirmation arrives. Only consider this when the hanging man appears at major resistance, with high volume, and with overbought RSI or stochastic readings.
Stop Loss Placement
The stop loss belongs above the high of the hanging man candle. This level represents the peak of bullish enthusiasm during the session. If price pushes above this level, the bearish thesis is invalidated and the uptrend may continue.
Add a small buffer above the high (a few cents or pips) to avoid getting stopped out by minor whipsaws or gap-ups.
Profit Targets
Consider the following target-setting methods for hanging man trades:
- Previous support: The nearest significant support level below the hanging man
- Moving average targets: The rising 20-day or 50-day moving average often acts as a magnet for pullbacks
- Fibonacci retracements: Apply Fibonacci levels to the prior upswing to identify the 38.2%, 50%, and 61.8% retracement zones
- Measured move: Measure the hanging man's total range (high to low of the shadow) and project it downward from the breakdown point
Hanging Man in Different Timeframes
The hanging man pattern appears across all timeframes, but its significance varies.
Daily and weekly charts produce the most reliable hanging man signals. These timeframes reflect the decisions of a broad pool of market participants, giving the pattern genuine statistical significance. A weekly hanging man at a major resistance level is one of the most powerful reversal warnings in technical analysis.
Intraday charts (1-minute to 1-hour) generate frequent hanging man candles, but the noise-to-signal ratio is much higher. Intraday hanging man candles should only be traded when they align with higher-timeframe resistance levels or when confirmed by intraday volume spikes.
Monthly charts produce rare but extremely significant hanging man signals. A monthly hanging man at an all-time high or multi-year resistance level can precede major market tops.
Combining the Hanging Man with Technical Indicators
The hanging man works best when combined with other technical tools for confluence.
RSI divergence. If the RSI shows bearish divergence (price making higher highs while RSI makes lower highs) when the hanging man forms, the reversal probability increases substantially.
MACD crossover. A MACD bearish crossover near the time of the hanging man adds another layer of confirmation.
Bollinger Band touch. A hanging man forming at or above the upper Bollinger Band indicates the price has reached an extreme extension, increasing the odds of mean reversion.
Volume indicators. Declining OBV or negative Chaikin Money Flow readings near a hanging man confirm that smart money is distributing rather than accumulating.
Common Mistakes When Trading the Hanging Man
Avoid these frequent errors that undermine hanging man setups.
Trading without confirmation. This is the most common mistake. The hanging man alone is not a sell signal — it is a warning that requires validation.
Ignoring the trend context. A hanging man only applies after uptrends. A similar candle in a downtrend or range-bound market is not a hanging man and should not be traded as one.
Overlooking volume. Low-volume hanging man candles are unreliable. Always check that volume supports the bearish thesis.
Fighting strong trends. In powerful bull markets, hanging man candles frequently fail. If the broader market trend is decisively bullish, treat hanging man signals with extra caution and require stronger confirmation.
Using it in isolation. The hanging man is most effective as part of a multi-factor analysis. Combine it with support and resistance, indicators, and volume for the best results.
Real-World Hanging Man Examples
The hanging man frequently appears at significant market turning points. Classic examples include:
- Individual stock tops: After an extended earnings-driven rally, a hanging man on heavy volume near a round-number resistance level often precedes multi-week pullbacks.
- Index tops: The S&P 500 and other major indices occasionally form weekly hanging man candles at all-time highs before corrections.
- Sector rotation points: When a sector ETF forms a hanging man after outperforming for several months, it can signal the beginning of sector rotation.
In each case, the hanging man serves as an early warning system rather than a guaranteed reversal signal. Traders who wait for confirmation and use proper risk management benefit from the pattern's predictive value without exposing themselves to excessive false-signal risk.
Frequently Asked Questions
Is the hanging man bullish or bearish?
The hanging man is a bearish reversal pattern. Despite looking identical to the bullish hammer, its appearance at the top of an uptrend gives it bearish implications. The long lower shadow reveals that sellers pushed prices significantly lower during the session, warning of a potential shift in momentum.
How reliable is the hanging man pattern?
The hanging man's reliability depends heavily on confirmation and context. Studies suggest that confirmed hanging man candles at resistance levels with above-average volume produce successful reversals roughly 55-65% of the time. Without confirmation, the success rate drops significantly. Always combine it with other analysis tools.
What is the difference between a hanging man and a shooting star?
Both are bearish reversal patterns at uptrend tops, but their shapes differ. The hanging man has a long lower shadow, while the shooting star has a long upper shadow. The shooting star shows that buyers pushed prices higher but sellers rejected the advance, closing the price near the session low.
Can the hanging man appear in a downtrend?
A hanging man-shaped candle in a downtrend is classified as a hammer, which is a bullish reversal pattern. The same candle shape carries opposite meanings depending on trend context. Always identify the prevailing trend before classifying the pattern.
What timeframe is best for the hanging man?
The daily chart is the most popular and reliable timeframe for trading the hanging man. Weekly charts produce fewer but more significant signals. Intraday charts generate many hanging man candles, but the noise-to-signal ratio is much higher and requires additional filtering.
Should I use the hanging man for stop-loss placement on long positions?
Yes. If you hold a long position and a hanging man forms on significant volume, it serves as a valuable warning. You might tighten your trailing stop to just below the hanging man's low or reduce your position size. If the confirmation candle closes bearish, consider exiting the long position entirely.
Disclaimer
This is educational content, not financial advice. Trading involves risk, and you should consult a qualified financial advisor before making any investment decisions. Past performance does not guarantee future results.
Related Articles
12 chapters covering charts, indicators, risk management & more. Plus weekly trading insights.