Pennant Pattern: How to Trade This Continuation Setup
⚡ Key Takeaways
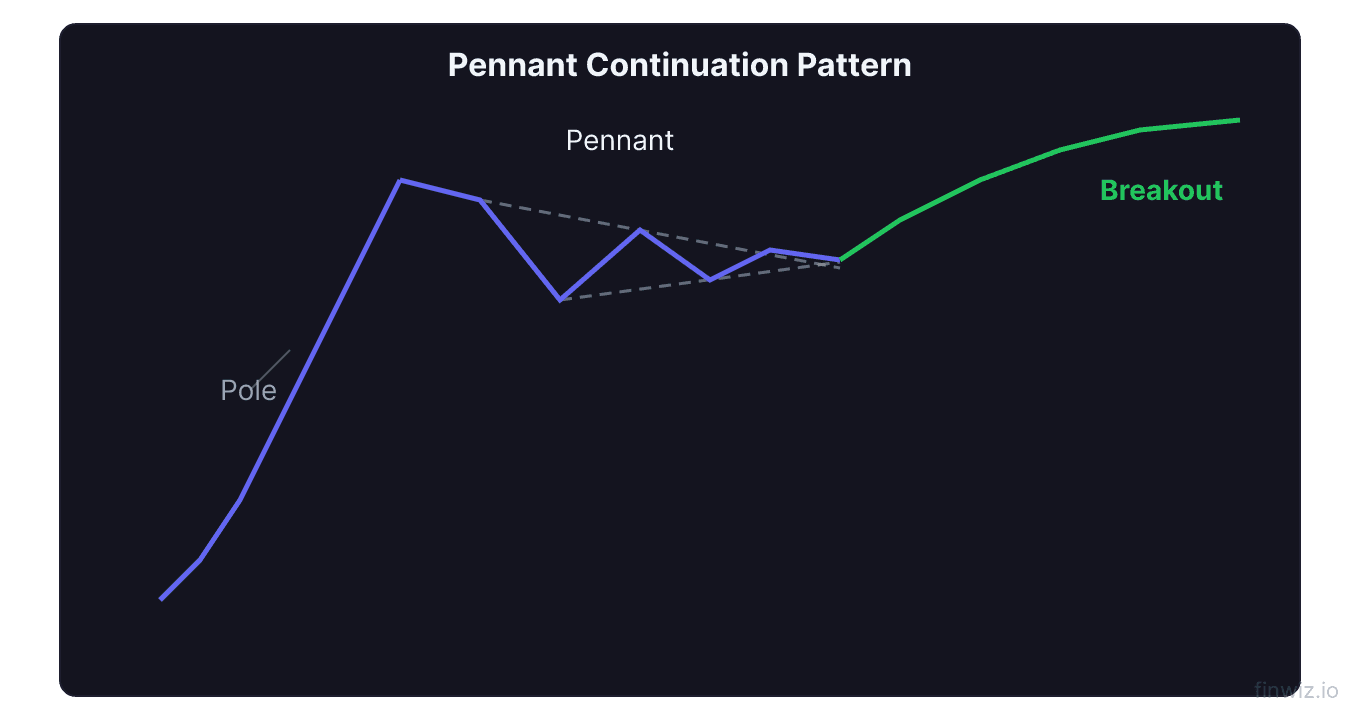
- The pennant is a short-term continuation pattern that forms after a sharp price move (the pole), followed by a brief period of converging trendlines (the pennant).
- Pennants resemble small symmetrical triangles and typically resolve in the direction of the prior trend within 1-3 weeks.
- Volume should be high during the pole, decline during the pennant consolidation, and expand on the breakout.
- The measured move target equals the length of the pole added to the breakout point.
- Pennants can be bullish (after an upward pole) or bearish (after a downward pole), depending on the direction of the preceding move.
What Is a Pennant Pattern?
The pennant pattern is a short-term continuation formation that signals a brief pause in a strong trend before the price continues in the same direction. It is closely related to the bull flag pattern but features converging trendlines rather than parallel ones, creating a small symmetrical triangle shape.
The pattern consists of two parts: the pole and the pennant. The pole is a sharp, steep price move that occurs on heavy volume. The pennant is the consolidation period that follows, characterized by converging trendlines that contain decreasing price swings. When price breaks out of the pennant in the direction of the pole, the trend resumes.
Pennants are popular among swing traders and momentum traders because they offer favorable risk-reward ratios within a well-defined structure. The pattern identifies the exact moment when a trending market pauses to catch its breath before its next surge.
Structure of the Pennant
Understanding each component helps you distinguish genuine pennants from similar-looking patterns.
The Pole
The pole is the initial sharp price movement that precedes the pennant. In a bullish pennant, the pole is a swift rally. In a bearish pennant, the pole is a sharp decline. The pole should be a decisive, momentum-driven move, not a gradual drift.
Key characteristics of a quality pole include high volume, a near-vertical price movement, and a duration of a few days to about two weeks. The pole represents the strong impulse that creates the trend energy which the pennant will eventually continue.
The Pennant (Consolidation)
The pennant itself is a small, converging formation that looks like a tiny symmetrical triangle. Two trendlines slope toward each other: one connecting the lower highs and one connecting the higher lows within the consolidation.
The pennant should be compact, typically lasting one to three weeks. It should be significantly shorter in duration than the pole. If the consolidation extends too long, the pattern loses its continuation characteristics and becomes a standard symmetrical triangle with a less predictable breakout direction.
Volume during the pennant should decline progressively. This contraction reflects the narrowing price range and the market's temporary pause. The declining volume creates the conditions for a volume expansion on the breakout.
Pro Tip
Bullish Pennants
A bullish pennant forms after a sharp rally (the pole) and resolves with an upside breakout that continues the uptrend.
Identification
Look for a sharp advance on high volume, followed by a brief consolidation where the price forms a small symmetrical triangle. The higher lows within the pennant show that buyers are maintaining their interest, while the lower highs reflect mild profit-taking by short-term traders.
Entry and Exit Rules
Entry: Buy when price closes above the upper trendline of the pennant on expanding volume. Some traders use an intraday break above the upper trendline as their trigger.
Stop loss: Place the stop below the lower trendline of the pennant at the point of breakout, or below the lowest point within the pennant.
Target: Add the length of the pole to the breakout point. This measured move target represents the minimum expected advance.
Bullish Target = Breakout Price + Pole LengthBearish Pennants
A bearish pennant forms after a sharp decline and resolves with a downside breakout that continues the downtrend.
Identification
Look for a sharp decline on high volume, followed by a brief consolidation that forms a small symmetrical triangle. The lower highs within the pennant show sellers maintaining pressure, while the higher lows reflect temporary short covering or bargain hunting.
Entry and Exit Rules
Entry: Sell short when price closes below the lower trendline of the pennant on expanding volume.
Stop loss: Place the stop above the upper trendline of the pennant or above the highest point within the pennant.
Target: Subtract the length of the pole from the breakdown point.
Bearish Target = Breakdown Price - Pole Length| Aspect | Bullish Pennant | Bearish Pennant |
|---|---|---|
| Pole Direction | Sharp rally | Sharp decline |
| Pennant Shape | Small symmetrical triangle | Small symmetrical triangle |
| Breakout Direction | Upside | Downside |
| Volume on Breakout | Expanding | Expanding |
| Stop Loss | Below pennant low | Above pennant high |
| Target | Pole length added up | Pole length subtracted down |
Pennant vs. Flag
The pennant and the flag are closely related continuation patterns, and traders sometimes use the terms interchangeably. However, there is a structural difference worth noting.
A flag has parallel trendlines that form a rectangular or slightly sloping channel. A pennant has converging trendlines that form a small symmetrical triangle. Both patterns follow a sharp pole, both show declining volume during consolidation, and both are expected to break out in the direction of the pole.
In practice, the distinction between a flag and a pennant matters less than the overall pattern quality. Whether the consolidation takes the form of parallel lines (flag) or converging lines (pennant), the key factors are the same: a strong pole on high volume, a brief consolidation on declining volume, and a breakout on expanding volume.
Some practitioners treat any short-term consolidation after a sharp move as a "flag and pennant" setup, combining both patterns into a single category. The trading rules (entry, stop, target) are essentially identical.
Pennant vs. Symmetrical Triangle
While the pennant looks like a small symmetrical triangle, there are important differences between the two patterns.
The symmetrical triangle is a larger pattern that can last weeks to months, can appear in any trend context, and can break in either direction. The symmetrical triangle is considered a neutral pattern until the breakout direction is confirmed.
The pennant is specifically a continuation pattern that must be preceded by a sharp pole. It is short-term (typically 1-3 weeks), and the expected breakout direction is determined by the pole's direction. The pennant inherits its directional bias from the pole, making it a higher-conviction trade than a symmetrical triangle.
If you see converging trendlines without a preceding sharp pole, you are looking at a symmetrical triangle, not a pennant. The absence of a pole removes the continuation bias.
Pro Tip
Volume Analysis for Pennants
Volume is the single most important confirmation tool for pennant patterns.
Pole volume should be significantly above average, showing strong momentum behind the initial move. The higher the volume on the pole, the more energy is stored for the eventual continuation.
Pennant volume should decline steadily as the consolidation progresses. Each swing within the pennant should have lower volume than the previous swing. This contraction shows that the consolidation is orderly and that participants are waiting for the next directional move rather than actively trading.
Breakout volume should expand noticeably when price exits the pennant. Volume on the breakout day should ideally exceed the average volume during the pennant period by at least 50-100%. A breakout on weak volume is a warning sign that the move may not follow through.
If volume fails to expand on the breakout, consider waiting for confirmation from the next session's close. If the second session also shows weak volume, the breakout may be a false move.
Time Duration and Pennant Validity
The duration of the pennant affects its reliability and implications.
Ideal duration: One to three weeks on a daily chart. This timeframe allows enough consolidation to create a tight pattern without losing the momentum generated by the pole.
Too short (less than 5 days): An extremely brief pennant may not have fully consolidated the prior move. While breakouts from very short pennants can work, they carry higher risk of immediate pullbacks.
Too long (more than 4 weeks): A consolidation that extends beyond three to four weeks begins to lose its classification as a pennant. The momentum from the pole dissipates over time, and the pattern transitions into a standard symmetrical triangle with a less predictable outcome.
The relationship between the pole duration and the pennant duration also matters. The pennant should be significantly shorter than the pole. A general guideline is that the pennant should last no more than one-third to one-half of the time the pole took to form.
Managing Pennant Trades
Once you enter a pennant breakout trade, managing the position effectively maximizes returns.
Initial stop: Set below the pennant low (for bullish) or above the pennant high (for bearish) immediately upon entry.
Breakeven stop: After the trade moves in your favor by an amount equal to your initial risk, move the stop to breakeven. This eliminates the possibility of a loss on the trade.
Partial profits: Consider taking half the position off at the halfway point to the measured move target. This locks in partial gains while allowing the remainder to target the full move.
Trailing stop: Once the trade is in profit, trail the stop using a short-term moving average (10-day or 20-day EMA) or behind significant swing lows/highs created during the move.
Pennant Patterns in Different Markets
Pennants appear across all liquid markets with varying characteristics.
In stocks, pennants are common during earnings season when a strong gap up or gap down creates the pole, followed by a brief consolidation as the market digests the news. These earnings-driven pennants can produce powerful continuation moves, especially in growth stocks.
In forex, pennants work well on the 4-hour and daily charts. Currency pair pennants often form during periods of strong directional momentum driven by central bank policy announcements or economic data releases. The 24-hour nature of forex means the consolidation tends to be smoother than in stocks.
In cryptocurrency, pennants are frequent due to the extreme volatility that regularly produces sharp poles. Crypto pennants should be traded with wider stops and adjusted position sizing to accommodate the larger price swings typical of digital assets.
In futures and commodities, pennants often form during supply or demand shocks that create sharp initial moves, followed by brief consolidations before the trend continues.
Common Mistakes with Pennant Patterns
Avoid these errors to improve your pennant trading results.
Misidentifying the pole. Without a strong, sharp preceding move, you do not have a pennant. A gradual drift followed by a small triangle is a symmetrical triangle, not a pennant. The pole must be a clear, momentum-driven move.
Trading against the pole's direction. Pennants are continuation patterns. Attempting to trade a bearish breakout from a bullish pennant (or vice versa) is fighting the pattern's inherent bias. While pennants can occasionally break against the pole, this is the lower-probability outcome.
Entering before the breakout. Some traders try to enter within the pennant, anticipating the breakout direction. While this offers better prices, it risks being stopped out if the pennant breaks the wrong way or takes longer than expected to resolve.
Ignoring the broader trend. A bullish pennant in a stock that is in a long-term downtrend may simply be producing a bear market rally rather than a genuine continuation. Consider the broader trend when evaluating pennant signals. The best pennants form within established trends on the daily chart and higher timeframes.
Frequently Asked Questions
What is the success rate of pennant patterns?
When all criteria are met (strong pole, declining volume during consolidation, breakout in the pole's direction on expanding volume), pennant patterns have an estimated success rate of 60-70%. The rate is higher for pennants that form within established trends and at key breakout levels. As with all chart patterns, the success rate should not be considered in isolation. Proper position sizing and risk management ensure that even the trades that fail do not significantly damage your overall performance.
How do I distinguish a pennant from a wedge?
The main difference is the preceding price action and the trendline orientation. A pennant must be preceded by a sharp pole (a strong, fast price move), and its converging trendlines are roughly symmetrical. A wedge does not require a pole and has both trendlines sloping in the same direction (both up in a rising wedge, both down in a falling wedge). Additionally, pennants resolve in the direction of the pole (continuation), while wedges typically resolve opposite to their slope direction (a rising wedge breaks down, a falling wedge breaks up).
Can a pennant break in the opposite direction of the pole?
Yes, while pennants have a strong bias toward breaking in the pole's direction, they can occasionally break the opposite way. This occurs perhaps 30-35% of the time. When a pennant breaks against the pole, the resulting move can be sharp because traders who positioned for the continuation are caught on the wrong side. To protect against this, always use a stop loss and do not over-commit your capital to any single pennant setup. Volume behavior on the breakout is usually the best indicator of whether the move is genuine.
Are pennants more reliable on certain timeframes?
Pennants are most reliable on the daily chart, where each candle represents a full trading session with significant participation. Weekly chart pennants are also reliable but form less frequently. Intraday pennants (15-minute, 1-hour) can be traded but have higher failure rates due to the lower participation and greater noise on shorter timeframes. If you trade intraday pennants, focus on those that form during the first few hours of the trading session when volume and momentum are strongest.
Disclaimer
This is educational content, not financial advice. Trading involves risk, and you should consult a qualified financial advisor before making any investment decisions. Past performance does not guarantee future results.
Related Articles
12 chapters covering charts, indicators, risk management & more. Plus weekly trading insights.