ABCD Pattern: Harmonic Trading Made Simple
⚡ Key Takeaways
- The ABCD pattern is a harmonic price structure consisting of two equivalent price legs (AB and CD) connected by a retracement (BC), forming a zigzag shape on the chart.
- The BC leg typically retraces 61.8% to 78.6% of the AB leg, and the CD leg extends 127.2% to 161.8% of the BC leg, based on Fibonacci ratios.
- The pattern provides precise entry, stop loss, and profit target levels based on the D point completion zone, making it ideal for rule-based trading.
- Both bullish and bearish ABCD patterns exist — the bullish version forms at the end of a decline (buy at D), while the bearish version forms at the end of a rally (sell at D).
- The ABCD is the foundational harmonic pattern — mastering it is essential before advancing to more complex structures like Gartley, butterfly, and bat patterns.
What Is the ABCD Pattern?
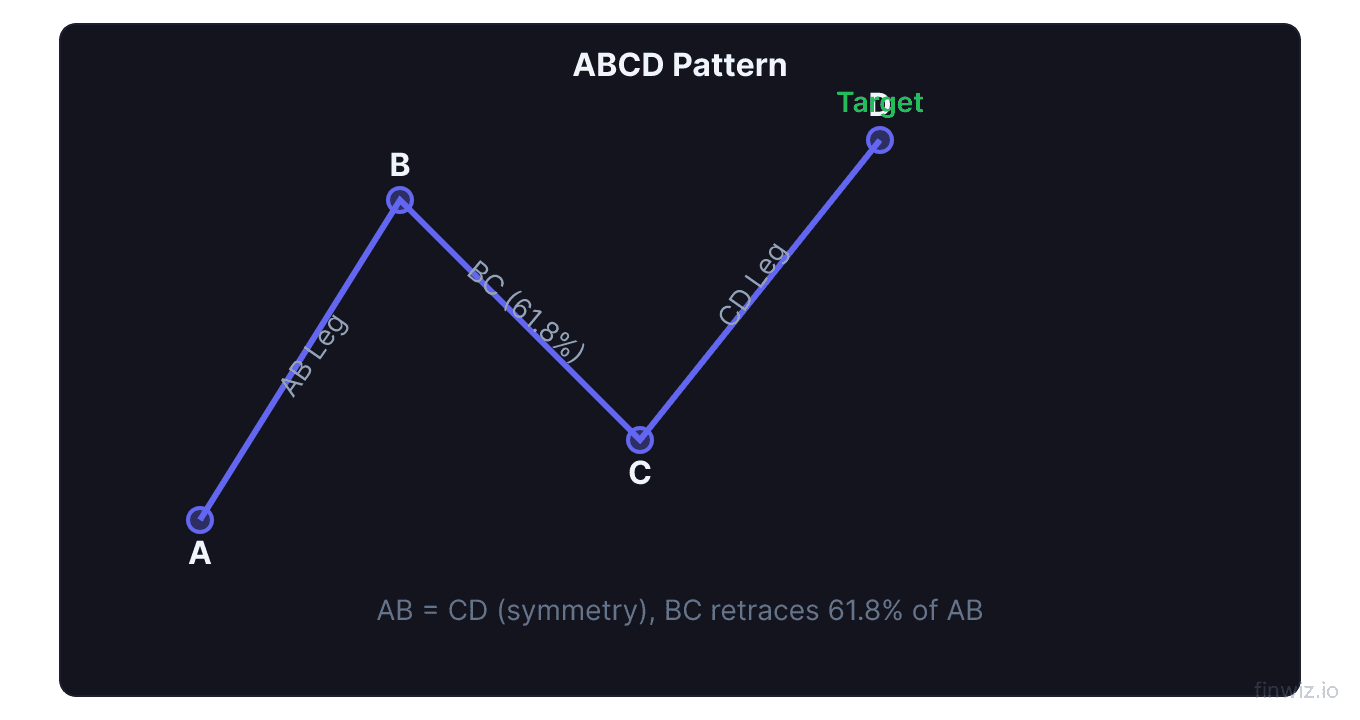
The ABCD pattern is the most fundamental harmonic pattern in technical analysis. It identifies a symmetrical price structure where two comparable price legs (AB and CD) are connected by a retracement leg (BC), creating a zigzag or lightning-bolt shape on the chart.
The pattern is grounded in the concept of market symmetry — the tendency for price movements to repeat in proportional, measurable legs. The ABCD pattern uses Fibonacci ratios to define the relationships between these legs, providing traders with precise zones for entries, stops, and targets.
Scott Carney and Larry Pesavento are among the traders who popularized harmonic pattern trading, building on the earlier work of H.M. Gartley. The ABCD pattern is the simplest harmonic structure and serves as the building block for all more complex harmonic patterns.
Structure of the ABCD Pattern
The pattern consists of four price points labeled A, B, C, and D, connected by three legs.
The AB Leg (Initial Move)
The AB leg is the first directional move. In a bullish ABCD, AB is a decline from point A (a swing high) to point B (a swing low). In a bearish ABCD, AB is a rally from point A (a swing low) to point B (a swing high). This initial leg establishes the pattern's scale.
The BC Leg (Retracement)
The BC leg is a retracement of the AB move. Price reverses direction and retraces a portion of the AB leg before resuming in the original AB direction. The BC retracement typically falls between specific Fibonacci levels.
The CD Leg (Completion Leg)
The CD leg is the final move that completes the pattern. Price resumes in the AB direction and travels from point C toward the projected D point. The CD leg has a defined Fibonacci relationship to the BC leg. Point D is the trade entry zone.
ABCD Fibonacci Relationships:Bullish ABCD Pattern
The bullish ABCD pattern forms during a decline and signals a potential buying opportunity at point D.
Visual Structure
- Point A: A swing high where the decline begins
- Point B: A swing low where the initial decline pauses
- Point C: A retracement rally (bounces 61.8%-78.6% of AB)
- Point D: The final low where the CD leg completes — this is the buy zone
The pattern looks like a zigzag moving lower: down (A to B), up (B to C), then down again (C to D). Point D represents a potential reversal zone where the decline may end and a new rally begin.
Trading the Bullish ABCD
Entry: Place a buy order at or near the projected D point. The D completion zone is calculated by applying the 1.272 to 1.618 Fibonacci extension of the BC leg from point C.
Stop loss: Place the stop below point D, typically 1-2 ATR units below the projected completion zone. If price moves significantly below D, the pattern has failed.
Profit targets:
- Target 1: Point C (the 38.2% retracement of the AD move)
- Target 2: Point A (full retracement of the pattern)
- Target 3: 1.272 or 1.618 Fibonacci extension of the AD move
Pro Tip
Bearish ABCD Pattern
The bearish ABCD pattern forms during a rally and signals a potential selling or shorting opportunity at point D.
Visual Structure
- Point A: A swing low where the rally begins
- Point B: A swing high where the initial rally pauses
- Point C: A retracement pullback (declines 61.8%-78.6% of AB)
- Point D: The final high where the CD leg completes — this is the sell zone
The pattern looks like a zigzag moving higher: up (A to B), down (B to C), then up again (C to D).
Trading the Bearish ABCD
Entry: Sell or short at or near the projected D point.
Stop loss: Place the stop above point D, typically 1-2 ATR units above the completion zone.
Profit targets:
- Target 1: Point C
- Target 2: Point A
- Target 3: Extensions below point A
Fibonacci Ratios in Detail
The precision of ABCD trading depends on correctly applying Fibonacci ratios. Here are the key relationships and their reliability.
| BC Retracement of AB | Corresponding CD Extension of BC | Pattern Quality |
|---|---|---|
| 0.382 (38.2%) | 2.618 (261.8%) | Less common, extended |
| 0.500 (50.0%) | 2.000 (200.0%) | Moderate |
| 0.618 (61.8%) | 1.618 (161.8%) | Classic, high quality |
| 0.707 (70.7%) | 1.414 (141.4%) | Good quality |
| 0.786 (78.6%) | 1.272 (127.2%) | Classic, high quality |
The reciprocal relationship between the BC retracement and the CD extension is key: a shallow BC retracement (38.2%) leads to an extended CD leg, while a deep BC retracement (78.6%) produces a more compact CD leg. The two "classic" combinations (0.618/1.618 and 0.786/1.272) are the most frequently occurring and most reliable.
Time Symmetry
Beyond price ratios, the ABCD pattern also exhibits time symmetry. In the ideal pattern, the number of bars in the AB leg approximately equals the number of bars in the CD leg.
This time element adds another dimension of validation:
- If AB took 15 bars and CD has taken 14 bars as price approaches the D zone, the time symmetry supports the pattern's completion
- If AB took 15 bars but CD has only taken 5 bars, the pattern may not yet be complete or may be forming a different structure
Time symmetry is a secondary validation tool, not a strict requirement. Focus on price ratios first, then check time for additional confirmation.
Identifying ABCD Patterns on Charts
Manual Identification Steps
- Identify a clear swing move (the AB leg) with a defined start and end point
- Watch for a retracement (BC leg) that falls within the 0.618-0.786 zone
- Project the D completion zone using the 1.272-1.618 extension of BC from point C
- Monitor price as it approaches the D zone for reversal signals
Using Fibonacci Tools
Most charting platforms include Fibonacci retracement and extension tools:
- Draw a Fibonacci retracement from A to B to identify the BC retracement level
- Once C is established, draw a Fibonacci extension from B to C to project D
- Mark the D completion zone on your chart as the trade setup area
Automated Scanning
Harmonic pattern scanners (available in platforms like TradingView, TC2000, or dedicated harmonic software) can identify ABCD patterns automatically. These tools scan for the required Fibonacci relationships across multiple securities and timeframes, alerting you to potential setups.
Risk Management for ABCD Trades
Position Sizing
Because ABCD patterns provide clearly defined stop levels (below D for bullish, above D for bearish), you can calculate precise position sizes based on your risk tolerance.
Position Size = (Account Risk Amount) / (Entry Price - Stop Price)Scaling Out
Consider a scaled exit strategy to balance profit capture with trend continuation:
- Exit one-third of the position at Target 1 (point C level)
- Exit one-third at Target 2 (point A level)
- Trail the remaining one-third with a moving average or ATR-based trailing stop
Common Mistakes with the ABCD Pattern
Forcing the pattern. Not every zigzag is an ABCD. The Fibonacci ratios must align within acceptable tolerances. If the BC retracement falls outside the 0.382-0.886 range, the structure is not a valid ABCD.
Ignoring context. An ABCD pattern that completes at a major resistance level (bullish ABCD) is less likely to succeed than one completing at support. Always check the broader chart structure.
Entering before completion. Wait for price to reach the D completion zone. Entering during the CD leg before D is reached means you are trading an unconfirmed pattern.
Setting stops too tight. Allow enough room for price to test slightly beyond the ideal D point. Many valid ABCD reversals overshoot D briefly before reversing.
Neglecting volume. Volume should decline during the CD leg (declining conviction in the trend) and increase at point D as reversal buyers or sellers step in. Use OBV or volume profile for confirmation.
ABCD Pattern Variations
Perfect ABCD (AB = CD)
The most basic variation where the CD leg equals the AB leg in both price distance and time duration. This produces a symmetrical pattern where D is easily projected by measuring AB and projecting the same distance from C.
Extended ABCD
When the CD leg is longer than the AB leg (CD = 1.272 or 1.618 times AB). This occurs when the BC retracement is shallow (38.2% or 50%), requiring a longer CD extension to reach the harmonic completion zone.
Compact ABCD
When the CD leg is shorter than the AB leg. This occurs with deep BC retracements (78.6% or higher). The compact version sometimes completes quickly and can catch traders off guard.
Frequently Asked Questions
What is the success rate of the ABCD pattern?
The ABCD pattern has a reported success rate of approximately 60-70% when properly identified with correct Fibonacci ratios and traded with appropriate risk management. The success rate increases significantly when the D point coincides with other technical confluence factors such as support/resistance levels, moving averages, or oversold/overbought RSI readings.
Can the ABCD pattern be used on any timeframe?
Yes, the ABCD pattern appears across all timeframes from 5-minute to monthly charts. Daily and 4-hour charts provide the best balance of reliability and trade frequency. Intraday ABCD patterns are valid but require tighter execution and faster decision-making.
How does the ABCD relate to other harmonic patterns?
The ABCD is the foundation of all harmonic patterns. The Gartley, butterfly, bat, and crab patterns all contain an ABCD structure as their core component, with additional price legs (an XA leg) adding complexity and specificity.
What happens if price blows through the D point?
If price moves significantly beyond the projected D zone without reversing, the pattern has failed. This is why stop losses are essential. A failed ABCD may transform into an extended pattern or simply indicate that the trend is too strong for a harmonic reversal at that level.
Should I trade every ABCD pattern I find?
No. Be selective and focus on ABCD patterns with strong confluence: D point at a key support/resistance level, volume confirmation, indicator alignment, and proper Fibonacci ratios. Quality over quantity is the foundation of successful harmonic trading.
Can the ABCD pattern be combined with other strategies?
Absolutely. Many traders combine ABCD patterns with Bollinger Band extremes, RSI divergence, or Ichimoku Cloud levels for additional confirmation. The ABCD provides the structural framework, while other tools validate the trade thesis.
Disclaimer
This is educational content, not financial advice. Trading involves risk, and you should consult a qualified financial advisor before making any investment decisions. Past performance does not guarantee future results.
Related Articles
12 chapters covering charts, indicators, risk management & more. Plus weekly trading insights.