Price Action Trading: Reading the Market Without Indicators
⚡ Key Takeaways
- Price action trading relies solely on reading raw price movement without lagging indicators
- Key candlestick patterns like pin bars, engulfing candles, and inside bars form the foundation of price action signals
- Institutional footprints can be identified through large range candles, rejection wicks, and volume spikes at key levels
- Price action traders focus on clean charts with only support/resistance levels and perhaps one moving average
- Mastering price action requires extensive screen time and the ability to read market context, not just patterns
What Is Price Action Trading?
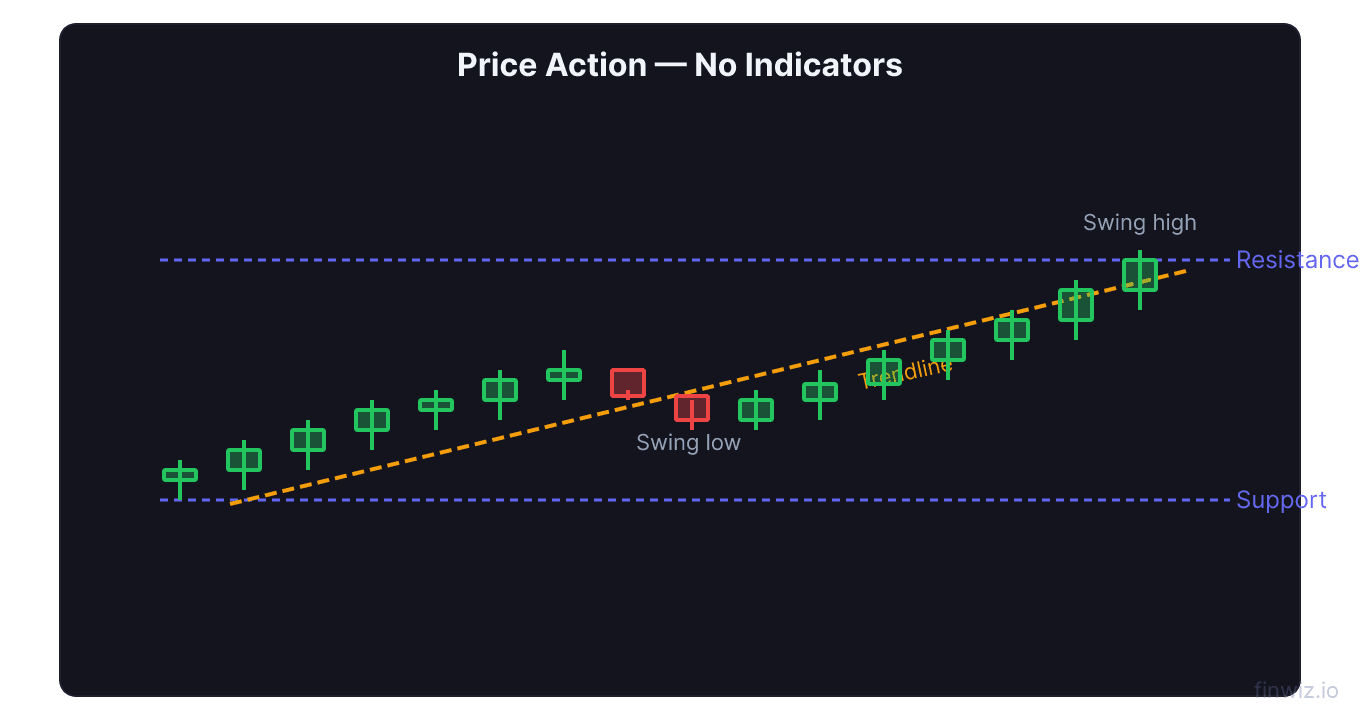
Price action trading is a method of analysis that relies entirely on reading raw price movement to make trading decisions. Price action traders strip their charts down to the bare essentials, eliminating most or all technical indicators in favor of analyzing candlestick patterns, support and resistance levels, and market structure.
The philosophy behind price action is straightforward: price is the ultimate indicator. Every oscillator, moving average, and momentum tool is derived from price. By going directly to the source, price action traders believe they get the fastest, most unfiltered view of what buyers and sellers are doing.
This is an advanced approach that requires significant screen time to master. Unlike indicator-based systems that generate mechanical signals, price action trading demands judgment, context reading, and pattern recognition skills that develop through experience.
Why Trade Without Indicators?
Technical indicators serve a purpose, but they come with inherent limitations.
Indicators lag. Most indicators are calculated from historical price data. By the time an indicator generates a signal, the move may already be well underway. Price action, by contrast, is real-time information.
Indicators can contradict each other. A trader using five indicators might find three saying buy and two saying sell. This analysis paralysis is eliminated when you focus on what price itself is telling you.
Indicators can create false confidence. When a mathematical formula tells you to buy, it feels scientific and objective. But the formula is still based on past prices and may not predict the future. Price action keeps you grounded in what is actually happening right now.
That said, many price action traders do keep one or two tools on their chart for context. A moving average (such as the 20 EMA or 200 SMA) and volume bars are common additions that complement raw price reading without cluttering the chart.
Pro Tip
Essential Candlestick Patterns
Price action traders rely heavily on candlestick patterns to identify potential entries and exits. Here are the most important patterns to master.
Pin Bar (Hammer / Shooting Star)
A pin bar has a small body and a long wick that extends in one direction. The long wick shows rejection of a price level.
- A bullish pin bar (hammer) has a long lower wick and appears at support. It shows buyers rejected lower prices.
- A bearish pin bar (shooting star) has a long upper wick and appears at resistance. It shows sellers rejected higher prices.
The wick should be at least two to three times the length of the body for a strong signal. The longer the wick relative to the body, the more forceful the rejection.
Engulfing Pattern
An engulfing pattern consists of two candles where the second candle's body completely engulfs the first.
- A bullish engulfing pattern occurs at the bottom of a downtrend: a small red candle followed by a larger green candle that completely covers the red candle's body. This shows buyers overwhelming sellers.
- A bearish engulfing pattern occurs at the top of an uptrend: a small green candle followed by a larger red candle that engulfs it.
Inside Bar
An inside bar is a candle whose entire range (high to low) fits within the range of the previous candle. Inside bars represent consolidation and indecision. They signal that a breakout is likely.
Trade the inside bar by entering in the direction of the break beyond the mother bar's high or low. Inside bars at key levels are particularly powerful because the consolidation is occurring at a point where a significant move is likely.
Doji
A doji has an open and close at nearly the same price, creating a cross or plus-sign shape. It represents perfect equilibrium between buyers and sellers. Dojis are significant at trend extremes, where they signal that the dominant side is losing conviction.
A doji at the top of an uptrend warns of a potential reversal. A doji at the bottom of a downtrend suggests selling pressure is exhausting.
Reading Market Structure
Beyond individual candle patterns, price action traders analyze the overall market structure to determine trend direction and strength.
Higher Highs and Higher Lows
An uptrend is defined by a series of higher highs and higher lows. Each swing high exceeds the previous one, and each pullback bottoms at a higher level than the last. As long as this structure is intact, the uptrend is healthy.
Lower Highs and Lower Lows
A downtrend is defined by lower highs and lower lows. Each rally fails at a lower level than the previous one, and each decline extends below the last low.
Structure Breaks
A break of structure occurs when the pattern of higher highs and higher lows (or lower highs and lower lows) is violated. In an uptrend, the first sign of trouble is when the price makes a lower low, breaking below the previous swing low. This does not guarantee a reversal, but it signals that the trend dynamics are changing.
Pro Tip
Institutional Footprints
One of the advanced applications of price action is identifying institutional activity on the chart. Large players like hedge funds, mutual funds, and pension funds move enormous amounts of capital, and their activity leaves footprints that can be read.
Signs of Institutional Buying
- Large range bullish candles appearing on high volume, especially after a pullback
- Multiple strong closes near the highs of daily candles within an uptrend
- Volume surges at support levels that hold, showing accumulation
- Gaps up on heavy volume that do not fill, suggesting urgent buying
Signs of Institutional Selling
- Large range bearish candles on high volume, especially after a rally
- Multiple closes near the lows of daily candles within a downtrend
- Volume surges at resistance levels, showing distribution
- Gaps down on heavy volume that do not fill
Absorption and Exhaustion
Absorption occurs when one side absorbs all the orders from the other side without the price moving. For example, if a stock repeatedly tests support with heavy selling volume but the price does not break down, institutional buyers are likely absorbing the sell orders. This sets up a powerful reversal.
Exhaustion occurs when a final surge of buying or selling happens on extreme volume, but the price barely moves or reverses sharply. This is the climax that marks the end of a move.
Key Levels for Price Action Trading
Price action traders focus on levels where their signals carry the most weight:
- Previous day's high and low: Widely watched, especially by day traders
- Swing highs and swing lows: Natural support and resistance points
- Round numbers: Psychological levels where orders cluster
- Moving averages: The 20 EMA, 50 SMA, and 200 SMA act as dynamic support and resistance
- Opening range: The high and low of the first 15-30 minutes of trading
A pin bar at a random price level is far less meaningful than a pin bar at a key support or resistance zone. Context is everything in price action trading.
Building a Price Action Trading Plan
A price action trading plan should include:
- Trend identification: Use market structure (higher highs/lows or lower highs/lows) to determine the dominant trend on your higher timeframe.
- Key level identification: Mark major support and resistance zones before the trading day begins.
- Signal recognition: Define which candlestick patterns you will trade and in what context.
- Entry rules: Specify exactly how you will enter (on the close of the signal candle, on the break of the signal candle's high/low, etc.).
- Stop loss rules: Define stop placement (beyond the signal candle's extreme, beyond the key level, etc.).
- Target rules: Specify how you will set targets (next key level, risk multiple, trailing stop).
- Position sizing: Calculate how many shares or contracts based on your stop distance and risk tolerance.
Frequently Asked Questions
Is price action trading better than using indicators?
Neither approach is inherently better. Price action trading offers real-time information without lag, but it requires more skill and experience to interpret correctly. Indicator-based trading provides more mechanical, rule-based signals but can lag and produce conflicting information. Many successful traders use a hybrid approach, combining price action reading with one or two select indicators.
How long does it take to learn price action trading?
Most traders need six months to a year of dedicated practice to become competent at reading price action. Unlike indicator systems that can be learned from a set of rules, price action requires developing an intuitive feel for market behavior through extensive screen time and trade review.
What markets work best for price action trading?
Price action trading works in any liquid market: stocks, forex, futures, and cryptocurrencies. The key requirement is sufficient liquidity and volatility for patterns to form and resolve. Thin, illiquid markets can produce unreliable price action signals.
Can I combine price action with indicators?
Yes. Many price action traders keep a moving average on their chart for trend context and use volume to confirm their signals. The RSI can also complement price action by confirming overbought or oversold conditions. The key is to let price action lead and use indicators only for confirmation.
What is the most important price action pattern?
The pin bar at a key level is arguably the single most important price action signal. When a strong rejection wick forms at a major support or resistance level on above-average volume, it represents a clear, high-probability trading opportunity with a defined risk point and logical target.
Disclaimer
This is educational content, not financial advice. Trading involves risk, and you should consult a qualified financial advisor before making any investment decisions. Past performance does not guarantee future results.
Related Articles
12 chapters covering charts, indicators, risk management & more. Plus weekly trading insights.