Mean Reversion Trading: Strategies for Buying the Dip
⚡ Key Takeaways
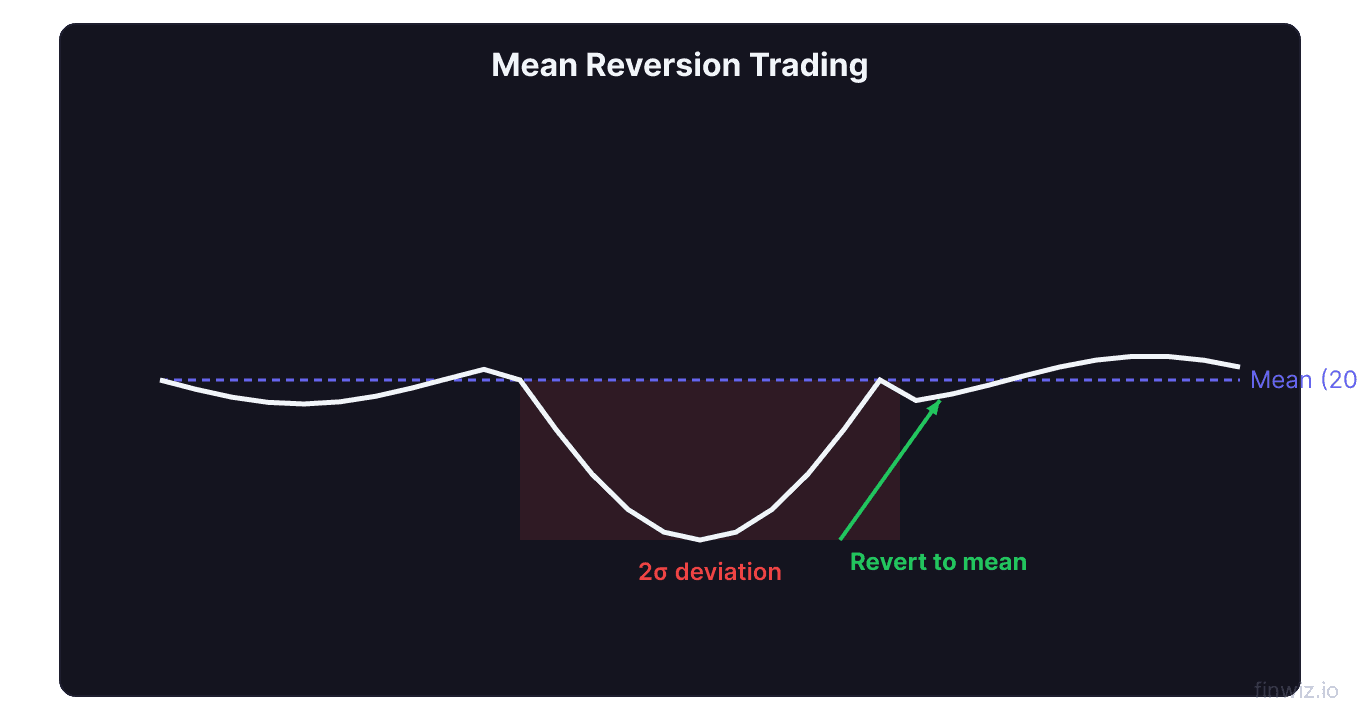
- Mean reversion is the theory that asset prices tend to return to their historical average over time, meaning extreme moves away from the mean (in either direction) are likely to reverse.
- Common mean reversion tools include RSI (buy when oversold below 30, sell when overbought above 70), Bollinger Band bounces (buy at the lower band, sell at the upper band), and Z-score measurements.
- Mean reversion strategies work best in range-bound and choppy markets where prices oscillate around a central value, and they fail in trending markets where prices persistently move away from the mean.
- The key risk is the "value trap" — buying a falling stock because it looks cheap relative to its average, only to watch it continue declining as the fundamental reality has permanently changed.
- Successful mean reversion trading requires strict risk management, including stop-losses for when the mean itself is shifting and the stock is not reverting but entering a new trend.
What Is Mean Reversion?
Mean reversion is the financial theory that asset prices and returns eventually move back toward their long-term average. When a stock deviates significantly from its average price — whether through a sharp rally or a steep decline — mean reversion theory predicts that it will eventually return to that average.
The concept is intuitive. If a stock historically trades at $100 and suddenly drops to $70 on temporary bad news, mean reversion theory suggests that the price will eventually return toward $100 as the market overcorrection fades. Conversely, if the stock spikes to $130 on hype, it will likely pull back toward $100 as the excitement dissipates.
Mean reversion is one of the oldest concepts in financial markets, captured by the saying "what goes up must come down" (and vice versa). It underpins billions of dollars in institutional trading strategies and forms the theoretical foundation for many popular technical indicators and oscillators.
However, mean reversion is not a universal law — it is a tendency that works under specific conditions. Understanding when it works and when it fails is the difference between profitable mean reversion trading and catching falling knives.
The Theory Behind Mean Reversion
Statistical Foundation
From a statistical perspective, mean reversion describes a process where values that are far from the average have a higher probability of moving toward the average than of continuing further away. This is related to the concept of regression to the mean, first described by Francis Galton in the 1880s.
In financial markets, mean reversion manifests because:
- Overreactions: Markets are driven by human emotion, and humans consistently overreact to both good and bad news. Mean reversion captures the correction of these overreactions.
- Fundamental anchoring: Stocks have intrinsic values based on earnings, cash flow, and assets. When prices deviate far from intrinsic value, fundamental forces pull them back.
- Arbitrage: Professional traders exploit mispricings, buying undervalued assets and selling overvalued ones, which pushes prices back toward fair value.
What Is "The Mean"?
The "mean" in mean reversion can be defined in several ways:
- Simple moving average: The average closing price over a specified period (20-day, 50-day, 200-day)
- Exponential moving average: A weighted average that emphasizes recent prices
- VWAP: The volume-weighted average price for intraday trading
- Fundamental mean: The intrinsic value based on P/E ratio, free cash flow, or other fundamental metrics
- Bollinger Band midline: The 20-period SMA used in Bollinger Bands
Z-Score: Measuring Distance from the MeanRSI-Based Mean Reversion Strategies
The Relative Strength Index (RSI) is the most popular indicator for mean reversion trading. RSI measures the speed and magnitude of recent price changes on a scale of 0 to 100, with traditional overbought (above 70) and oversold (below 30) thresholds.
The Basic RSI Mean Reversion Strategy
Buy setup:
- RSI drops below 30 (oversold)
- RSI turns upward and crosses back above 30
- Enter long on the crossover
- Target: Midline (RSI returns to 50) or price returns to its moving average
- Stop-loss: Below the recent swing low
Sell/short setup:
- RSI rises above 70 (overbought)
- RSI turns downward and crosses back below 70
- Enter short on the crossover
- Target: Midline (RSI returns to 50) or price returns to its moving average
- Stop-loss: Above the recent swing high
Refined RSI Mean Reversion (Larry Connors Method)
Larry Connors popularized a more aggressive RSI mean reversion approach using a 2-period RSI instead of the standard 14-period:
- Stock is above its 200-day moving average (long-term uptrend intact)
- 2-period RSI drops below 10 (extremely oversold in the short term)
- Buy at the close
- Sell when 2-period RSI rises above 70
This strategy has shown strong backtested results because it buys short-term dips within long-term uptrends — combining mean reversion (the short-term RSI) with trend following (the 200-day MA filter).
Pro Tip
Bollinger Band Bounce Strategy
Bollinger Bands are a natural mean reversion tool because they visually display how far price has deviated from its average (the middle band is a 20-period SMA, and the outer bands are 2 standard deviations away).
How the Bounce Strategy Works
Buy signal:
- Price touches or pierces the lower Bollinger Band
- A bullish candlestick pattern forms (hammer, bullish engulfing, etc.)
- RSI confirms oversold condition
- Enter long with a target at the middle band (20 SMA)
Sell signal:
- Price touches or pierces the upper Bollinger Band
- A bearish candlestick pattern forms (shooting star, bearish engulfing)
- RSI confirms overbought condition
- Enter short with a target at the middle band
Bollinger Band Width as a Filter
The Bollinger Band Width (the distance between the upper and lower bands) tells you whether mean reversion conditions are favorable:
- Narrow bands (contracted): Price is in a low-volatility consolidation. Bollinger Band touches are less meaningful because the bands are too close together.
- Wide bands (expanded): Price has recently experienced high volatility. Touches of the bands in this environment are more meaningful because they represent genuine statistical extremes.
The best Bollinger Band mean reversion setups occur after a period of band expansion (high volatility) when price has stretched far from the mean and is likely to snap back.
Z-Score Mean Reversion
The Z-score is the most statistically rigorous way to measure mean reversion opportunities. It expresses how many standard deviations the current price is from the mean.
Building a Z-Score Strategy
- Calculate the mean: Use a 20-50 day simple moving average
- Calculate the standard deviation: Over the same lookback period
- Calculate the Z-score: (Price - Mean) / Standard Deviation
- Generate signals: Buy when Z-score falls below -2.0, sell when it rises above +2.0
Z-Score in Pairs Trading
The Z-score is especially powerful in pairs trading — a market-neutral strategy where you simultaneously go long one stock and short a related stock. The Z-score measures how far the price ratio between the two stocks has deviated from its historical average.
For example, if Coca-Cola (KO) and PepsiCo (PEP) typically trade at a price ratio of 1.2:1, and the ratio suddenly shifts to 1.4:1, the Z-score will be elevated. A pairs trader would short KO and buy PEP, expecting the ratio to revert to its mean.
When Mean Reversion Fails
Understanding when mean reversion does not work is as important as understanding when it does. Mean reversion strategies fail systematically in specific market conditions.
Trending Markets
In strongly trending markets — whether powered by fundamental momentum, sector rotation, or macro forces — prices can move persistently away from their mean for weeks or months. Mean reversion signals generated during these trends produce a series of losing trades.
A stock that drops from $100 to $80 might look oversold on RSI, but if the company just lost its largest customer, the new mean might be $60, not $100. Buying at $80 expecting a reversion to $100 would produce a painful loss.
Structural Breaks
A structural break occurs when the fundamental nature of a company or market changes permanently. Examples:
- A company loses its competitive moat to a disruptor
- A regulatory change eliminates a revenue stream
- An industry undergoes permanent decline (e.g., print media)
- A fraud is discovered that renders historical data meaningless
In these cases, the historical mean is no longer relevant. The stock is not deviating from its mean — the mean itself has shifted.
The Value Trap Problem
The most dangerous failure mode of mean reversion is the value trap — buying a stock that appears cheap relative to its history but is actually cheap for good reason. The stock continues declining as the market correctly reprices the asset to reflect a deteriorated fundamental reality.
Pro Tip
Combining Mean Reversion with Trend Following
The most robust trading approaches combine mean reversion with trend-following filters. The 200-day moving average is the most common filter:
Mean Reversion Within a Trend
- Bullish setup: Stock is above its 200-day MA (uptrend), and RSI drops below 30 (short-term oversold). Buy the dip.
- Bearish setup: Stock is below its 200-day MA (downtrend), and RSI rises above 70 (short-term overbought). Sell the rally.
This combination works because you are trading mean reversion in the direction of the larger trend. The short-term oversold condition within a long-term uptrend is a high-probability buy setup because both the mean reversion tendency (reversion from oversold) and the trend force (underlying uptrend) are working in your favor.
When to Use Each Approach
| Market Condition | Strategy | Why |
|---|---|---|
| Strong uptrend | Buy mean reversion dips | Dips within uptrends are buying opportunities |
| Strong downtrend | Sell mean reversion rallies | Rallies within downtrends are selling opportunities |
| Range-bound | Pure mean reversion both directions | No dominant trend, prices oscillate around the mean |
| Breakout/transition | Trend following (abandon mean reversion) | The mean is shifting; reversion trades will lose |
Risk Management for Mean Reversion
Position Sizing
Mean reversion strategies often have a high win rate (60-70%+) but small average wins relative to occasional large losses. This risk profile demands careful position sizing:
- Never risk more than 1-2% of capital per trade
- Use the ATR to set appropriate stop distances
- Scale into positions rather than taking the full size at once
Stop-Loss Placement
The challenge with mean reversion stops is that oversold stocks can get more oversold before reverting. Tight stops get triggered frequently, while loose stops expose you to large drawdowns.
A balanced approach:
- Set initial stops at 1.5-2x ATR below entry
- If the position moves in your favor, trail the stop to break even
- Accept that mean reversion trades occasionally hit stops — the strategy's edge comes from the aggregate of many trades, not from any single trade
Maximum Drawdown Rules
Implement a circuit breaker for your mean reversion strategy: if you hit a predetermined number of consecutive losses (e.g., 4-5 in a row), pause trading and reassess. Consecutive losses in a mean reversion strategy usually indicate that market conditions have shifted from range-bound to trending, and your strategy is no longer appropriate.
FAQ
Does mean reversion work for all stocks?
No. Mean reversion works best for large-cap, liquid stocks and ETFs that are broadly followed by institutional investors. These instruments tend to revert because mispricings are quickly arbitraged by professional traders. Small-cap stocks, biotechs, and stocks with binary catalysts (earnings surprises, regulatory decisions) are less likely to revert and more likely to trend.
What is the best timeframe for mean reversion trading?
Mean reversion works across timeframes, but the strongest evidence exists for short-term (1-10 day) mean reversion in equities. Day traders use it with minute-by-minute data, swing traders use it on daily charts, and statistical arbitrage funds use it on tick-level data. Longer-term mean reversion (months to years) overlaps with value investing.
How do I know if a market is range-bound or trending?
Use the ADX indicator. ADX below 20-25 suggests a range-bound market (favorable for mean reversion). ADX above 25-30 suggests a trending market (favorable for trend following). You can also look at whether the 50-day and 200-day moving averages are flat (range-bound) or sloping (trending).
What is the difference between mean reversion and value investing?
Both involve buying assets below their perceived fair value. The difference is timeframe and methodology. Mean reversion is a short-to-medium-term technical strategy based on statistical deviations from price averages. Value investing is a long-term fundamental strategy based on discounted cash flow analysis and balance sheet evaluation. However, they share the same core belief: extreme mispricings eventually correct.
Can mean reversion strategies be automated?
Yes, and many are. Mean reversion strategies are among the most commonly automated because their rules are clear and objective (RSI below 30, Z-score below -2, price at the lower Bollinger Band). Quantitative hedge funds and algorithmic traders run mean reversion strategies across hundreds or thousands of instruments simultaneously, capturing small statistical edges at scale.
Disclaimer
This is educational content, not financial advice. Trading involves risk, and you should consult a qualified financial advisor before making any investment decisions. Past performance does not guarantee future results.
Related Articles
12 chapters covering charts, indicators, risk management & more. Plus weekly trading insights.