Range Trading: How to Profit When Stocks Move Sideways
⚡ Key Takeaways
- Range trading profits from buying at support and selling at resistance when a stock is moving sideways without a clear trend
- Identifying a true range requires at least two tests of both support and resistance, creating a defined trading channel
- Oscillators like RSI and stochastic are the primary tools for timing entries and exits within a range
- Range trading has a high win rate but limited profit per trade, making position sizing and discipline critical
- Ranges eventually break, and failing to recognize the breakout is the biggest risk for range traders
What Is Range Trading?
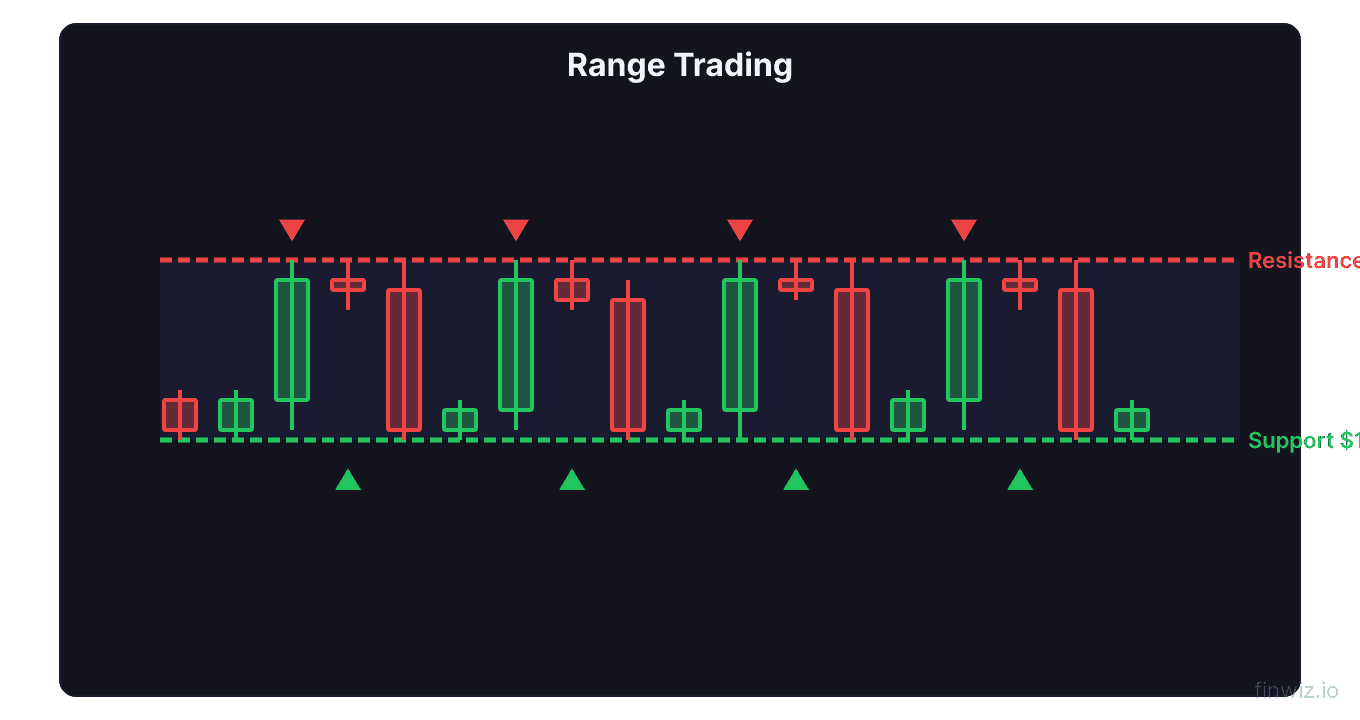
Range trading is a strategy that profits from buying near the bottom and selling near the top of a defined price range. When a stock moves sideways between clear support and resistance levels, range traders capitalize on the repetitive bouncing between these boundaries.
Markets spend a significant portion of their time in ranges. Estimates vary, but most technical analysts agree that stocks trend roughly 30% of the time and trade in ranges the remaining 70%. This means range trading opportunities are far more frequent than trending opportunities, making it a valuable skill for any swing trader.
The core concept is straightforward: buy near support where price has previously bounced, sell near resistance where price has previously reversed, and repeat until the range breaks. The strategy works because support and resistance levels represent zones where supply and demand are concentrated, creating predictable reversal points.
Identifying Sideways Markets
Not every stock that pauses is in a tradeable range. Here is how to identify genuine ranges worth trading:
Requirements for a Valid Range
At least two touches of support. Price must bounce from the same level at least twice, confirming that buyers consistently step in at that price.
At least two touches of resistance. Price must reverse from the same level at least twice, confirming that sellers consistently appear at that price.
Defined width. The range should be wide enough to generate profit after commissions and slippage. A range of 5-15% of the stock price is ideal for swing trading. Ranges under 3% are too tight to trade profitably.
Duration. Ranges that have persisted for at least 3-4 weeks (15+ trading days) are more reliable than brief pauses within a trend. Longer ranges build more supply and demand at the boundaries, making them more predictable.
Signs the Market Is Range-Bound
- Flat moving averages: The 20-day and 50-day moving averages are horizontal or slightly converging, not sloping clearly up or down
- Low ADX: The ADX indicator below 20-25 signals the absence of a trend
- Bollinger Band squeeze: The bands narrow as volatility compresses within the range
- Failed breakout attempts: Price briefly pokes above resistance or below support but quickly reverses back into the range
Buy Support / Sell Resistance
The execution of range trading follows a simple cycle:
Buying at Support
Entry criteria:
- Price approaches the lower boundary of the range (support)
- An oscillator confirms oversold conditions (RSI below 30, stochastic below 20)
- A bullish reversal candle forms at support (hammer, bullish engulfing, morning star)
- Volume decreases on the decline to support (selling exhaustion)
Stop-loss: Place your stop 1-2% below the support level. If support breaks, the range is ending and you need to exit immediately.
Profit target: The upper boundary of the range (resistance), or slightly below it to ensure execution.
Selling at Resistance
Exit criteria:
- Price approaches the upper boundary of the range (resistance)
- An oscillator confirms overbought conditions (RSI above 70, stochastic above 80)
- A bearish reversal candle forms at resistance (shooting star, bearish engulfing, evening star)
- Volume decreases on the rally to resistance (buying exhaustion)
For traders who short stocks, resistance also provides an opportunity to enter short positions targeting a return to support.
Range Width = Resistance Level − Support LevelExample:
- Support: $45, Resistance: $52, Range width: $7
- Buy at $45.50 (slightly above support), Stop at $44 (below support)
- Risk: $1.50, Reward: $6.50 (to resistance at $52)
- Risk-reward ratio: 4.3:1
Pro Tip
Oscillators for Timing: RSI
The Relative Strength Index (RSI) is the most popular oscillator for range trading. RSI measures the speed and change of price movements on a scale of 0 to 100.
How to use RSI in a range:
- RSI below 30 at support = oversold = potential buy signal
- RSI above 70 at resistance = overbought = potential sell signal
- RSI divergence at boundaries strengthens the signal (price makes equal lows at support, but RSI makes higher lows = bullish divergence)
RSI settings for range trading: The standard 14-period RSI works well for daily charts. For more sensitive signals, reduce to 7-9 periods. For smoother, less frequent signals, increase to 21 periods.
Important caveat: RSI overbought/oversold signals are reliable in ranges but dangerous in trends. In a strong uptrend, RSI can stay above 70 for weeks while the stock keeps rising. Only use RSI mean-reversion signals when you have confirmed the stock is range-bound.
Oscillators for Timing: Stochastic
The stochastic oscillator compares a stock's closing price to its price range over a given period. It consists of two lines: %K (fast) and %D (slow, a moving average of %K).
How to use stochastic in a range:
- %K crosses above %D below 20: Bullish crossover in oversold territory. Buy signal at support.
- %K crosses below %D above 80: Bearish crossover in overbought territory. Sell signal at resistance.
- Stochastic divergence: Like RSI divergence, adds conviction to reversal signals at range boundaries.
Standard settings: 14-period %K, 3-period %D smoothing. For faster signals, use 5,3,3 settings. For swing trading, 14,3,3 or 21,7,7 work well.
Combining RSI and stochastic: When both oscillators simultaneously confirm oversold at support or overbought at resistance, the signal is stronger. Wait for agreement between the two rather than acting on either one alone.
When Ranges Break
Every range eventually ends with a breakout. Recognizing the breakout early is critical because range traders who do not exit can be caught on the wrong side of a powerful move.
Signs a Breakout Is Coming
Volume surge: Volume increases significantly as price approaches the boundary. In a normal range touch, volume is declining. When volume expands at the boundary, the supply/demand balance is shifting.
Narrowing range: The swings within the range get smaller. Higher lows form below resistance or lower highs form above support. This compression indicates a breakout is imminent.
Failed oscillator signal: RSI reaches overbought at resistance, but price does not reverse. The oscillator signal fails. This means buyers are stronger than the range boundary, and a breakout is likely.
Multiple tests in quick succession: Price tests resistance three or four times within a few days rather than making orderly swings. This "knocking on the door" pattern often precedes a breakout.
How to Protect Yourself
Hard stop-loss below support (for longs). If support breaks decisively, exit. Do not hold and hope for a return into the range.
Close all positions at the first sign of a breakout. If you are short from resistance and price breaks above resistance on heavy volume, cover immediately. The loss from the range trade is small; the loss from fighting a breakout can be enormous.
Consider a breakout position. Some range traders also trade breakouts. When the range finally breaks, they flip from range trading to trend following, entering in the direction of the breakout with a stop inside the former range.
Real-World Range Trading Example
Stock ABC has been trading between $48 support and $55 resistance for 6 weeks.
Trade 1 (Long at support):
- RSI hits 28 and stochastic shows a bullish crossover at $48.50
- Buy at $48.80 with stop at $47.50
- Risk: $1.30 per share
- Stock rallies to $54.50 over 8 days. Sell at $54.50.
- Profit: $5.70 per share (438% of risk, 4.38:1 reward-to-risk)
Trade 2 (Short at resistance):
- RSI hits 73 and stochastic shows a bearish crossover at $54.80
- Short at $54.50 with stop at $55.80
- Risk: $1.30 per share
- Stock drops to $49 over 10 days. Cover at $49.20.
- Profit: $5.30 per share (408% of risk)
Trade 3 (Long at support, range breaks):
- RSI hits 32 at $48.20
- Buy at $48.50 with stop at $47.50
- Stock drops to $47 on heavy volume. Stop hit at $47.50.
- Loss: $1.00 per share
- Range has broken. No more range trades on this stock.
Two winners and one loser. Net profit: $5.70 + $5.30 - $1.00 = $10.00 per share. This illustrates why the favorable risk-reward within a range creates overall profitability even with inevitable breakout losses.
Range Trading Position Sizing
Because ranges have defined boundaries, position sizing is straightforward:
Step 1: Determine your maximum risk per trade (1-2% of account).
Step 2: Calculate the distance from entry to stop-loss.
Step 3: Shares = Maximum risk / Stop distance.
Example: $50,000 account, 1% risk = $500 max risk. Stop distance = $1.50. Shares = $500 / $1.50 = 333 shares.
Since range trades have a high win rate (60-70% with proper confirmation), some traders risk slightly more per trade than they would on trend trades. However, never exceed 2% per trade because a single breakout failure can undo several winners if position size is too large.
Frequently Asked Questions
How long do ranges typically last?
Most tradeable ranges last 2-8 weeks. Some stocks range for months, especially large-caps in low-volatility environments. The longer the range, the more powerful the eventual breakout tends to be. Short ranges (under 2 weeks) are harder to trade because there is not enough room for oscillators to cycle between overbought and oversold.
Can I range trade options instead of stocks?
Yes, but the time decay on options works against you. Each round trip through the range takes time, and the options lose value while you wait. If you use options for range trading, sell options (covered calls at resistance, cash-secured puts at support) rather than buying them. This way, time decay works in your favor.
What is the best timeframe for range trading?
Daily charts are the standard for swing-level range trading. 4-hour charts work for more active traders. Weekly charts reveal larger ranges suitable for position trading. Avoid trading ranges on very short timeframes (1-minute, 5-minute) because the boundaries are less defined and noise dominates.
Should I trade both sides of the range (long and short)?
Trading both sides doubles your opportunities, but shorting requires a margin account and carries additional risks (unlimited loss potential, borrowing costs). Most swing traders focus on the long side (buying at support) and simply avoid trading the short side unless they are comfortable with short selling mechanics.
How do I know if a stock is ranging or just pausing before continuing a trend?
Check the broader trend context. If the stock rallied from $30 to $50 and is now ranging between $48 and $55, this is likely a bullish continuation pattern, not a permanent range. The breakout will probably be to the upside. If there is no prior trend (the stock has been around $50 for six months), it is a genuine range with no directional bias.
Disclaimer
This is educational content, not financial advice. Trading involves risk, and you should consult a qualified financial advisor before making any investment decisions. Past performance does not guarantee future results.
Related Articles
12 chapters covering charts, indicators, risk management & more. Plus weekly trading insights.