Channel Trading: How to Draw & Trade Price Channels
⚡ Key Takeaways
- Channel trading is a technical strategy that involves drawing parallel trendlines around price action to identify a structured range within which price oscillates between support (lower line) and resistance (upper line).
- There are three types of channels: ascending channels (uptrend), descending channels (downtrend), and horizontal channels (range-bound), each offering distinct trading opportunities.
- The core strategy is to buy at channel support and sell at channel resistance, with stops placed outside the channel to protect against breakouts.
- Channel breakouts — when price closes decisively above or below the channel — often signal the start of a new, accelerated trend and represent some of the most powerful trading setups in technical analysis.
- Channels are most reliable when they contain at least three touches on each trendline and are confirmed by increasing volume on moves toward the channel boundaries.
What Is Channel Trading?
Channel trading is a technical analysis approach where traders identify two parallel trendlines that contain price action — a support line (lower boundary) and a resistance line (upper boundary). Price bounces between these boundaries like a ball between walls, creating a predictable, tradeable range.
Channels appear on charts across all timeframes and all instruments. A 5-minute chart of the S&P 500 futures might show a channel that lasts a few hours, while a weekly chart of a blue-chip stock might reveal a channel that persists for months. The principle is the same at every scale: price respects the channel boundaries until a breakout occurs.
What makes channel trading particularly attractive is its simplicity and objectivity. Once a channel is identified, the trading rules are clear: buy at support, sell at resistance, and exit if the channel breaks. There is minimal ambiguity compared to more complex trading approaches, making channels one of the most accessible patterns for traders at any experience level.
Drawing an Ascending Channel
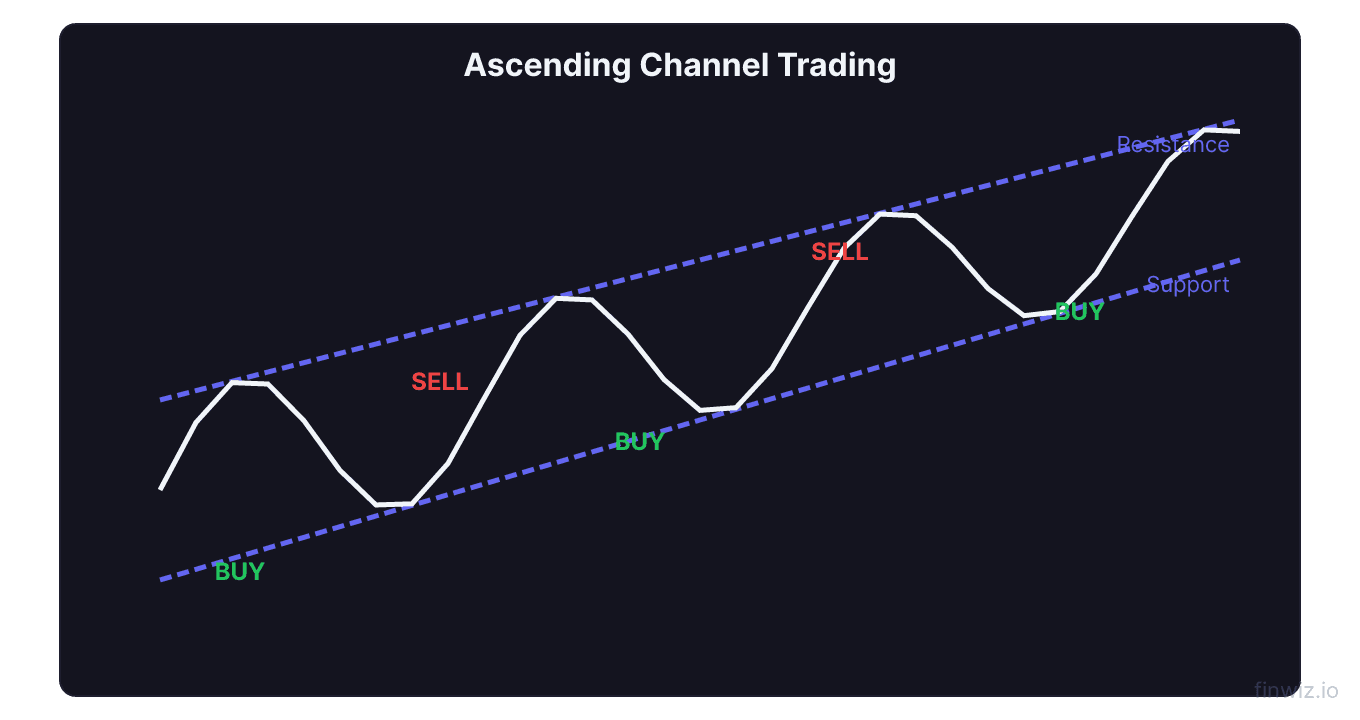
An ascending channel (also called a rising channel or uptrend channel) slopes upward from left to right. Price is making higher highs and higher lows, and the channel contains this uptrend within two parallel boundaries.
How to Draw It
- Identify the uptrend: Look for a stock making a series of higher lows and higher highs
- Draw the lower trendline (support): Connect at least two (preferably three) swing lows with a straight line. These are the higher lows that define the uptrend.
- Draw the upper trendline (resistance): Draw a parallel line from the highest swing high. This line should run parallel to the lower trendline.
- Validate: The channel is valid when price has touched each trendline at least twice (three times or more is stronger)
Trading the Ascending Channel
- Buy at the lower trendline: When price pulls back to the channel support line, look for bullish candlestick patterns like hammers or engulfing patterns to confirm the bounce
- Sell (or take partial profits) at the upper trendline: As price approaches the channel resistance, consider scaling out
- Stop-loss: Place stops below the lower trendline (typically 1-2 ATR below the line)
- Trend bias: Since the channel is ascending, the bias is bullish — long trades have a higher probability than short trades
Ascending Channel Trade Example:Pro Tip
Drawing a Descending Channel
A descending channel (falling channel or downtrend channel) slopes downward, containing a series of lower highs and lower lows within two parallel declining trendlines.
How to Draw It
- Identify the downtrend: Look for a stock making lower highs and lower lows
- Draw the upper trendline (resistance): Connect at least two swing highs — these are the lower highs defining the downtrend
- Draw the lower trendline (support): Draw a parallel line from the lowest swing low
- Validate: Confirm with at least two touches on each line
Trading the Descending Channel
- Sell/short at the upper trendline: When price rallies to channel resistance, look for bearish reversal patterns like shooting stars or bearish engulfing patterns
- Cover shorts (or buy) at the lower trendline: As price approaches channel support
- Stop-loss: Place stops above the upper trendline
- Trend bias: The dominant trend is bearish — short trades have higher probability
Descending channel trades are inherently more challenging because shorting carries unique risks (unlimited loss potential, short squeeze risk, borrow costs). Many traders prefer to simply avoid descending channels and wait for a bullish breakout above the upper trendline.
Drawing a Horizontal Channel
A horizontal channel (also called a rectangular consolidation, trading range, or price box) has flat parallel trendlines. Price oscillates between horizontal support and horizontal resistance with no directional bias.
Characteristics
- Price bounces between a defined floor and ceiling
- No clear trend direction — bulls and bears are in equilibrium
- Often forms after a strong move (either up or down) as the market digests the prior trend
- Can persist for weeks or months
Trading the Horizontal Channel
Horizontal channels are the purest form of range trading:
- Buy at support, sell at resistance: The classic range-trading approach
- Use oscillators: RSI and Stochastic work exceptionally well in range-bound markets. Buy when RSI reaches oversold (below 30) near support; sell when RSI reaches overbought (above 70) near resistance.
- Bollinger Band bounces: Bollinger Bands contract during range-bound periods. Trades at the bands align with trades at the channel boundaries.
- Equal opportunity: Unlike ascending and descending channels, horizontal channels offer equal probability for long and short trades
Channel Breakouts
The most powerful move in channel trading is the breakout — when price closes decisively outside the channel. Breakouts signal the end of the channel's equilibrium and the beginning of a new, often accelerated trend.
Identifying a Valid Breakout
Not every move outside the channel is a genuine breakout. Many are false breakouts that quickly reverse back into the channel. Valid breakouts typically feature:
- Strong closing candle: Price closes well beyond the trendline, not just a wick
- Above-average volume: A breakout on volume 1.5-2x the 20-day average is more reliable
- Multiple bars: The price stays outside the channel for at least 2-3 bars after the initial break
- Retest: Price often comes back to the broken trendline (which now acts as support/resistance) before continuing the breakout direction
Measured Move Target
The classic channel breakout target is the channel width projected from the breakout point:
Channel Breakout Target:Breakout from Ascending Channels
When price breaks above an ascending channel's upper trendline, the uptrend is accelerating. This is typically very bullish and can produce rapid gains as the rate of price increase steepens.
When price breaks below an ascending channel's lower trendline, the uptrend has failed. This is a significant bearish signal because the pattern of higher lows has been violated.
Breakout from Descending Channels
An upward breakout from a descending channel is one of the most bullish reversal signals in technical analysis. It indicates that the downtrend has ended and a new uptrend is beginning. These breakouts frequently occur after a period of declining volume within the channel (accumulation) followed by a volume surge on the breakout.
A downward breakdown from a descending channel (acceleration of the downtrend) is less common but extremely bearish when it occurs.
Pro Tip
Volume Confirmation in Channel Trading
Volume is the most important confirming tool for channel trading.
Healthy Channel Behavior
- Volume increases as price moves toward channel boundaries (buyers step in at support, sellers step in at resistance)
- Volume decreases during the move from one boundary toward the other (passive movement between the walls)
- Volume climax at channel boundaries can signal an imminent bounce
Breakout Volume
- Breakout with high volume: Strong confirmation — the breakout is likely genuine
- Breakout with low volume: Suspect — higher probability of a false breakout
- Volume declining within the channel: Often precedes a breakout as the energy within the pattern compresses
Common Channel Trading Mistakes
Mistake 1: Forcing Channels onto Non-Channel Price Action
Not all price action fits neatly into channels. If you have to stretch or distort the trendlines to make them fit, the channel is not valid. A legitimate channel has clean, well-defined touches on both trendlines.
Mistake 2: Trading Against the Trend in Trending Channels
In ascending channels, shorting at resistance is lower probability than buying at support. In descending channels, buying at support is lower probability than shorting at resistance. Always give the primary trend the benefit of the doubt.
Mistake 3: Ignoring Breakout Signals
Some traders become so attached to the channel that they continue buying at support even after the lower trendline has clearly broken. If the channel breaks, respect the signal and adjust your bias accordingly.
Mistake 4: Not Accounting for Channel Slope
A steeply ascending channel is more fragile than a gradually ascending one. Steep channels (greater than 45-degree slope) frequently collapse into more sustainable angles. Be prepared for a channel breakdown when the slope is extreme.
Channels and Other Technical Tools
Channels with Moving Averages
The midline of a channel often aligns with a moving average. A 50-period moving average running through the center of a channel provides an additional reference point for entries and exits. Pull back to the moving average midline for potential entries.
Channels with Fibonacci Retracements
Draw Fibonacci retracement levels within the channel to identify potential bounce levels on pullbacks toward channel support. The 50% and 61.8% retracement levels within the channel are common inflection points.
Channels with RSI Divergence
RSI divergence near channel boundaries strengthens the signal. If price touches channel resistance while RSI makes a lower high (bearish divergence), the probability of a bounce off resistance increases. Conversely, bullish RSI divergence at channel support reinforces the buy signal.
FAQ
How many touches does a channel need to be valid?
A minimum of two touches on each trendline (four total contact points) is required, but three touches on each line provides significantly higher reliability. The more touches a channel has, the more market participants are aware of it, and the more likely it is to continue holding.
Do channels work on all timeframes?
Yes. Channels appear on charts from 1-minute to monthly timeframes. However, channels on higher timeframes (daily, weekly) tend to be more reliable because they reflect broader, more durable supply-and-demand dynamics. Intraday channels can break more easily due to news events and sudden order flow changes.
What is the best indicator to use with channel trading?
RSI is arguably the best companion indicator for channel trading. RSI overbought readings near channel resistance confirm sell signals, and RSI oversold readings near channel support confirm buy signals. Bollinger Bands are also excellent because they naturally adapt to channel-like price behavior.
How do I handle a false breakout from a channel?
False breakouts (where price briefly exits the channel then reverses back inside) are common. To avoid them: (1) wait for a closing candle outside the channel, not just a wick, (2) require above-average volume on the breakout, (3) wait for a successful retest of the broken trendline before entering in the breakout direction. If a breakout fails, the reversal back inside the channel often provides a tradeable signal in the opposite direction.
Can I automate channel trading?
Yes, though automated channel detection requires defining precise mathematical rules for trendline identification. Some trading platforms (like TradingView with Pine Script) allow you to code channel detection algorithms. The primary challenges are defining what constitutes a "touch" of a trendline and handling the ambiguity of trendline slope selection.
Disclaimer
This is educational content, not financial advice. Trading involves risk, and you should consult a qualified financial advisor before making any investment decisions. Past performance does not guarantee future results.
Related Articles
12 chapters covering charts, indicators, risk management & more. Plus weekly trading insights.