Relative Volume (RVOL): Why It's a Day Trader's Best Filter
⚡ Key Takeaways
- Relative volume (RVOL) compares a stock's current trading volume to its historical average, normalizing activity levels so you can identify unusual interest regardless of a stock's typical volume.
- For day trading, RVOL is arguably the single most important pre-market filter, with stocks above 2.0 RVOL providing the volatility, momentum, and liquidity that intraday strategies require.
- Time-adjusted RVOL, which compares current volume to the average volume traded by the same time of day, is far more accurate than raw RVOL because trading volume follows a predictable U-shaped intraday pattern.
- RVOL serves as an excellent breakout confirmation tool, as breakouts accompanied by RVOL of 1.5x or higher have significantly better follow-through, while breakouts on normal volume are more likely to fail.
- Extremely high RVOL (above 10x) can signal a climax event where the stock may be approaching a turning point, requiring extra caution due to the potential for violent reversals.
What Is Relative Volume?
Relative volume (RVOL) is a metric that compares a stock's current trading volume to its average volume over a specified lookback period. It answers a simple but critical question: is this stock trading more or less actively than usual?
Raw volume numbers are difficult to interpret in isolation. A stock that trades 2 million shares might seem active, but if its average daily volume is 10 million shares, it is actually quiet. Conversely, a stock trading 500,000 shares might seem thin, but if its average is only 100,000, it is experiencing a massive surge of interest.
RVOL normalizes volume, allowing you to compare activity levels across any stock regardless of its typical trading volume.
RVOL = Current Volume / Average Volume (over N periods)Most traders use a 10-day or 20-day average as the baseline, though some platforms allow custom lookback periods.
Why Relative Volume Matters for Day Traders
For day traders, RVOL is arguably the single most important pre-market filter. Stocks with elevated RVOL are more likely to produce the volatility, momentum, and liquidity that day trading strategies require.
Volatility
High RVOL indicates that something unusual is happening with the stock. This could be an earnings report, a news catalyst, a sector-wide event, or institutional activity. Whatever the cause, unusual volume creates unusual price movement, and price movement is how traders profit.
Liquidity
High RVOL means more shares are being traded, which translates to tighter bid-ask spreads and better order fills. This allows you to enter and exit positions more efficiently with less slippage.
Momentum
Stocks with high RVOL tend to trend more decisively. When many participants are involved, moves tend to be directional rather than choppy. This creates cleaner setups for breakout trades and trend-following strategies.
Pro Tip
RVOL Benchmarks and Interpretation
Different RVOL levels carry different implications:
| RVOL Level | Interpretation | Trading Implication |
|---|---|---|
| Below 0.5 | Very quiet, well below average | Avoid for day trading |
| 0.5 - 1.0 | Below average to normal | Limited momentum |
| 1.0 - 1.5 | Slightly above average | Mild interest |
| 1.5 - 2.0 | Elevated | Good candidate for active trading |
| 2.0 - 5.0 | Significantly elevated | Strong catalyst likely, high momentum |
| Above 5.0 | Extreme | Major news event, potential climax |
For day trading, focus on stocks with RVOL of 2.0 or higher. For swing trading, RVOL is less critical on a daily basis but is important for confirming breakouts and reversals.
Time-Adjusted RVOL
One of the most common mistakes with RVOL is comparing current volume to the full-day average without adjusting for time of day. Volume follows a predictable U-shaped pattern throughout the trading day: it is highest at the open, lowest during the midday lull, and picks up again into the close.
If it is 10:30 AM and a stock has traded 1 million shares against a daily average of 3 million, the raw RVOL would be only 0.33. But by 10:30 AM, a stock typically trades only about 30-40% of its daily volume, meaning 1 million shares might actually represent an RVOL of 1.0 or higher when adjusted for time.
Time-adjusted RVOL compares the current volume to the average volume traded by that same time of day over the lookback period. This gives you a much more accurate picture of whether the stock is unusually active.
Time-Adjusted RVOL = Volume traded so far today / Average volume traded by this time of dayMany advanced trading platforms and scanners offer time-adjusted RVOL as a built-in feature. If yours does not, be aware of the time-of-day bias when interpreting raw RVOL numbers, especially during midday trading.
Using RVOL as a Scanner Filter
RVOL is one of the most effective filters for stock screeners and scanners. Here is how to incorporate it into your scanning workflow:
Pre-Market Scanner Setup
Before the market opens, scan for stocks that are already showing unusual pre-market activity:
- RVOL greater than 2.0 (compared to average pre-market volume)
- Price change greater than 2% from the previous close
- Minimum price of $5 (to avoid highly volatile penny stocks)
- Minimum average daily volume of 500,000 shares (ensures baseline liquidity)
Intraday Scanner Setup
During the trading day, use RVOL as a real-time filter:
- Time-adjusted RVOL greater than 2.0
- Price near key level (near the high of day, near a support or resistance level)
- Minimum price of $5
- Relative strength or weakness compared to the market index
End-of-Day Scanner for Swing Trading
For swing traders, scan after the close for stocks that had unusual volume:
- Daily RVOL greater than 1.5
- Breakout above resistance or breakdown below support
- Positive or negative divergence on the RSI
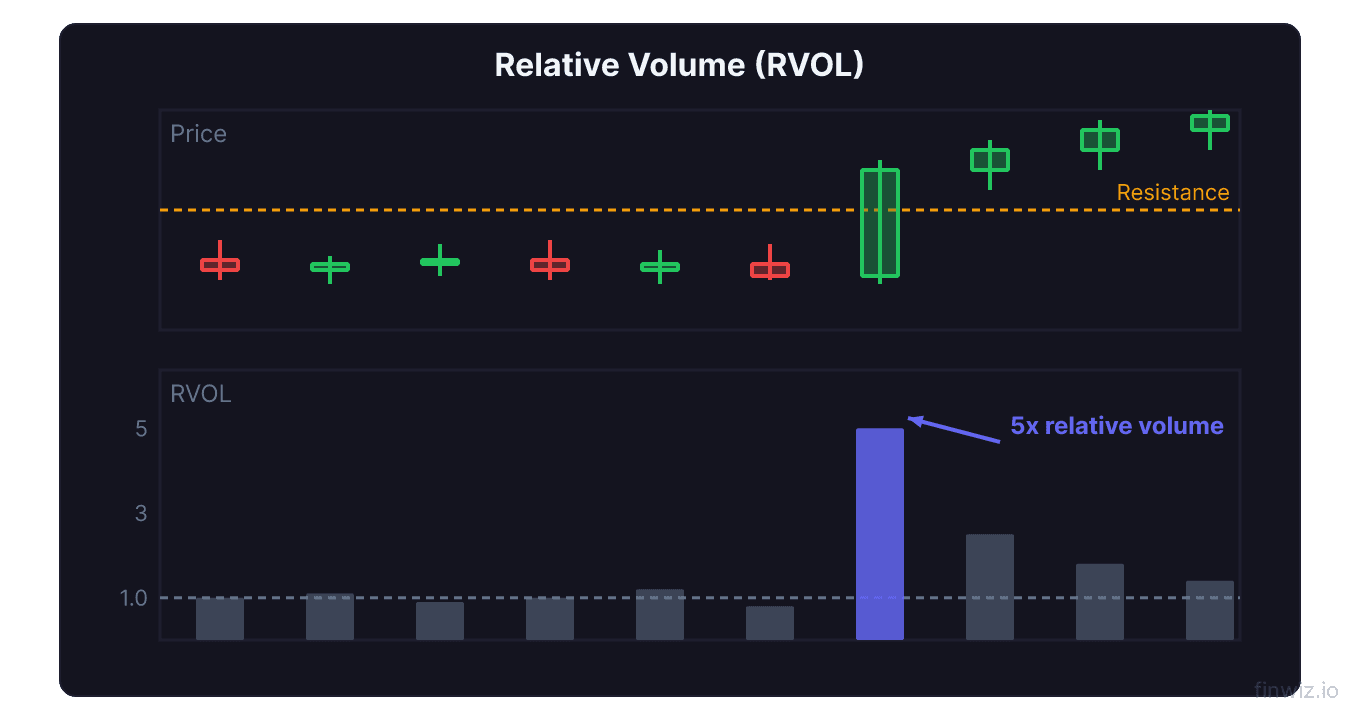
RVOL and Breakout Confirmation
RVOL is an excellent tool for confirming breakouts. A stock breaking above resistance should exhibit a clear spike in relative volume. Without an RVOL surge, the breakout may lack the participation needed to sustain the move.
Guidelines for using RVOL with breakouts:
- Breakout candle RVOL should be 1.5x or higher compared to the average
- Pullback candles should have RVOL below 1.0, showing that the pullback is on light volume
- Continuation candles should see RVOL pick up again, confirming renewed interest in the breakout direction
When you see a breakout with an RVOL of 3.0 or higher, the probability of follow-through increases significantly. This level of participation indicates that institutional players, not just retail traders, are driving the move.
RVOL in Different Market Conditions
RVOL behaves differently depending on the overall market environment:
In strong trending markets, RVOL tends to be elevated across many stocks as broad participation drives volume. Individual stock RVOL signals carry less weight because elevated volume is the norm.
In range-bound or quiet markets, RVOL signals stand out more clearly. A stock showing 3x RVOL in a quiet market is a significant outlier worth attention.
During earnings season, many stocks show elevated RVOL around their earnings dates. This is expected and does not carry the same surprise value as an RVOL spike on a random Tuesday.
On low-volume days (such as the day before a holiday), RVOL can be misleading because the average it compares against includes normal-volume days. Be cautious with RVOL readings on atypical trading days.
Combining RVOL with Other Metrics
RVOL is most powerful when combined with other tools:
- RVOL + float: High RVOL on a low-float stock can produce extreme moves because a large percentage of available shares are changing hands.
- RVOL + ATR: High RVOL combined with a stock already showing high Average True Range produces the most volatile opportunities.
- RVOL + RSI: High RVOL combined with an oversold or overbought RSI can indicate a capitulation or climax event.
- RVOL + price level: High RVOL combined with price at a key support or resistance level creates high-conviction setups.
Frequently Asked Questions
What RVOL should I look for as a day trader?
Most day traders filter for stocks with an RVOL of at least 2.0. This ensures the stock has enough momentum and liquidity for intraday trading. Some aggressive day traders push this threshold to 3.0 or higher, focusing only on the most active names of the day.
Can RVOL be too high?
Yes. Extremely high RVOL (above 10x) can indicate a climax event where the stock may be approaching a turning point. These situations are difficult to trade because the extreme volatility can produce violent reversals. Exercise caution with extremely high RVOL, especially if the stock has already moved significantly.
How is RVOL different from regular volume?
Regular volume is an absolute number (e.g., 5 million shares). RVOL is a ratio that compares current volume to the stock's own average volume. RVOL normalizes volume, making it comparable across stocks with different typical activity levels.
Should I use RVOL for swing trading?
RVOL is most critical for day trading but is also useful for swing trading, particularly for confirming breakouts. A breakout on high RVOL has a higher probability of follow-through than one on normal volume. However, swing traders do not need to filter for RVOL in the same way day traders do.
What lookback period should I use for RVOL?
The most common lookback periods are 10 days and 20 days. A 10-day average captures recent activity levels, while a 20-day average provides a broader baseline. Some traders use both: if the 10-day RVOL and the 20-day RVOL both show elevated readings, the signal is particularly strong.
Disclaimer
This is educational content, not financial advice. Trading involves risk, and you should consult a qualified financial advisor before making any investment decisions. Past performance does not guarantee future results.
Related Articles
12 chapters covering charts, indicators, risk management & more. Plus weekly trading insights.