Market Profile & Footprint Charts: Institutional Volume Analysis
⚡ Key Takeaways
- Market Profile is a charting technique that organizes price data by time and volume to reveal the value area where the most trading activity occurs, helping traders distinguish between fair value and price extremes.
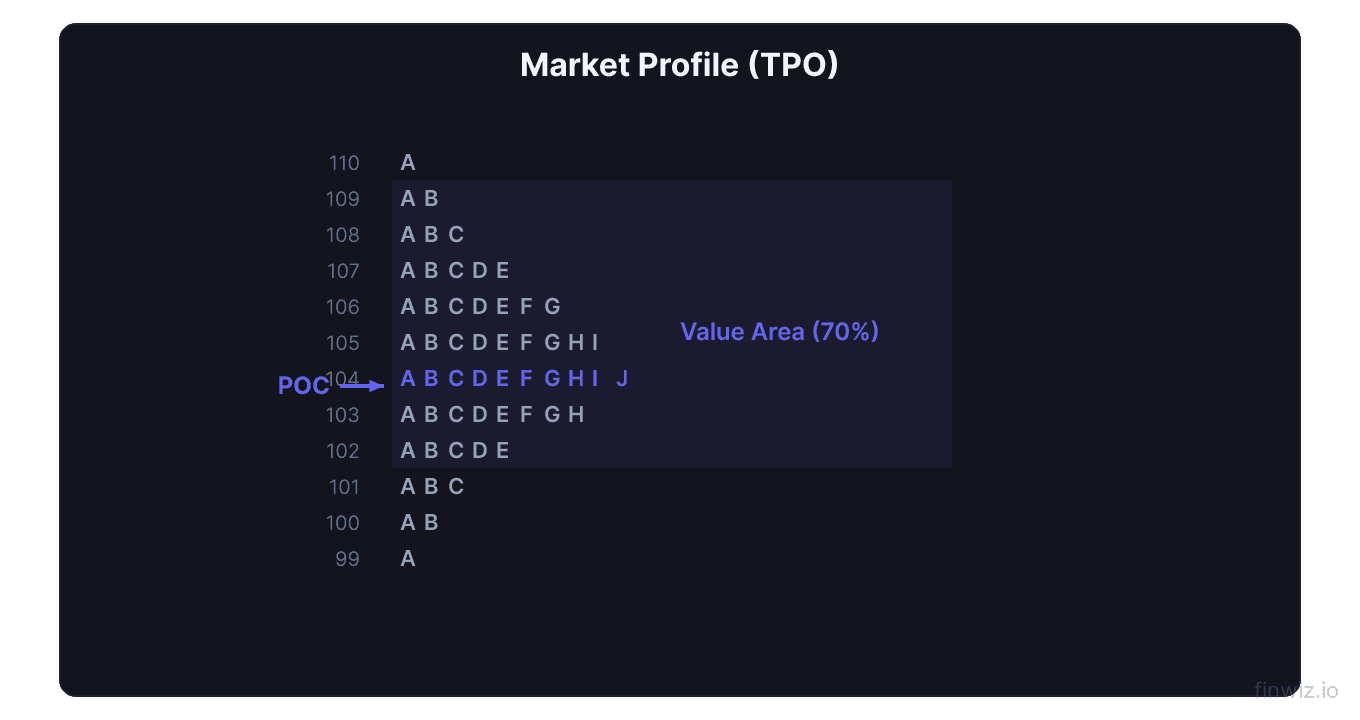
- The chart uses TPO (Time Price Opportunity) blocks — each block represents a price level traded during a specific time period, stacking horizontally to form a distribution curve that typically resembles a bell shape.
- The Value Area encompasses approximately 68% of the day's trading activity (one standard deviation), with the Point of Control (POC) marking the single price level with the most TPO blocks — the "fairest price" of the session.
- Single prints (prices visited only once) and the Initial Balance (first hour's range) provide critical context for identifying institutional activity and potential breakout zones.
- Footprint charts (a modern evolution of Market Profile) add order flow data to each price level, showing the actual delta between buy and sell orders for granular institutional-level analysis.
What Is Market Profile?
Market Profile is a charting and analytical method developed by J. Peter Steidlmayer at the Chicago Board of Trade (CBOT) in the 1980s. It organizes price and time data into a distribution format that reveals where trading activity is concentrated, helping traders identify value, balance, and imbalance in the market.
Unlike traditional charts that plot price against time on an X-Y axis, Market Profile rotates the perspective. Time is compressed into lettered blocks (TPOs) that stack horizontally at each price level, creating a shape that resembles a statistical bell curve when the market is in balance. This distribution reveals something that candlestick and bar charts cannot: the difference between prices where participants actively traded (fair value) and prices that were briefly visited but rejected (extremes).
For institutional and professional traders, Market Profile provides a framework for understanding auction market theory — the idea that markets move between balanced states (where buyers and sellers agree on value) and imbalanced states (where price searches for new value). This framework helps traders identify high-probability trade locations based on where value is accepted and where it is rejected.
TPO Charts: The Foundation
What Is a TPO?
A Time Price Opportunity (TPO) is a single block printed on the Market Profile chart when price trades at a specific level during a specific time period. Each trading day is divided into 30-minute periods, and each period is assigned a letter (A, B, C, D, etc.).
If during period "D" (the fourth 30-minute period of the session), the stock trades between $150 and $155, a "D" is printed at each $0.50 increment from $150 to $155. This creates 10 TPO blocks for period D at those price levels.
How the Profile Builds
As the day progresses, each 30-minute period adds its letter to the relevant price levels. The resulting shape shows you:
- Where price spent the most time: Multiple letters stacked at the same price level indicate that many different time periods traded there — the market accepted this price as fair value
- Where price spent little time: A single letter at a price level means the market visited that price briefly and left — it was rejected
TPO Chart Construction Example (simplified):Pro Tip
The Value Area
The Value Area is the range of prices where approximately 68% of the session's trading activity occurred (measured by TPO count or volume). It represents one standard deviation of the profile's distribution and identifies the zone where buyers and sellers reached agreement on value.
Calculating the Value Area
- Start with the Point of Control (the price level with the most TPOs)
- Add the TPOs from the price level immediately above and below the POC
- Continue adding TPOs from whichever side (above or below) has more at the next level
- Stop when the cumulative TPOs reach approximately 68% of the total
Value Area High (VAH) and Value Area Low (VAL)
- VAH (Value Area High): The upper boundary of the value area — the highest price within the 68% zone
- VAL (Value Area Low): The lower boundary — the lowest price within the 68% zone
These levels act as powerful support and resistance:
- VAH as resistance: Price approaching the VAH from below may find selling pressure from traders who believe price is at the upper edge of fair value
- VAL as support: Price approaching the VAL from above may find buying interest from traders who see value at the lower edge
Day-Over-Day Value Area Analysis
Comparing the current day's developing value area with the previous day's settled value area creates actionable trading scenarios:
| Current Day's Open | Interpretation | Trading Bias |
|---|---|---|
| Above yesterday's VAH | Market opening above value → bullish | Buy dips to yesterday's VAH |
| Within yesterday's value area | Market accepting prior value → balanced | Range trade within value area |
| Below yesterday's VAL | Market opening below value → bearish | Sell rallies to yesterday's VAL |
Point of Control (POC)
The Point of Control is the single price level with the highest TPO count (or highest volume, depending on the implementation). It represents the "fairest price" of the session — the level where the market spent the most time and transacted the most volume.
Why the POC Matters
The POC acts as a magnet for price. Markets tend to spend the majority of their time near the POC because it represents the equilibrium between buyers and sellers. When price moves away from the POC, there is a statistical tendency for it to return — a mean reversion concept built directly into the market's structure.
Naked POC
A naked POC is a Point of Control from a previous session that has not yet been revisited by price. These levels act as magnets for future price action — unfinished business that the market is likely to return to eventually.
Tracking naked POCs from the past several sessions gives you a roadmap of price levels that may attract future trading activity.
Migrating POC
During the trading day, the POC may shift (migrate) as new TPOs are added. A POC that migrates upward suggests that value is being accepted at higher prices (bullish). A POC that migrates downward suggests value is shifting lower (bearish). A stationary POC indicates balance and acceptance of the current value level.
Single Prints
Single prints are TPO blocks that appear alone at a price level — only one 30-minute period traded there. They represent prices that the market passed through quickly without accepting as fair value.
What Single Prints Tell You
Single prints occur when price moves rapidly through a zone, typically driven by institutional order flow or a sudden shift in sentiment. They indicate:
- Aggressive directional activity: A large buyer or seller pushed price through these levels without pause
- Potential revisit zones: The market often returns to fill single print areas, as these represent untested prices with no established acceptance
- Initiative activity: Single prints at the day's extremes are often left by institutional traders initiating large positions
Single Prints as Support/Resistance
When price returns to a single print area, one of two things happens:
- The level holds: Price reverses at the single print zone, confirming that the original rejection was significant
- The level fails: Price trades through the single prints, establishing new value and often leading to an accelerated move as the "air pocket" left by the single prints is filled
Initial Balance
The Initial Balance (IB) is the price range established during the first hour of trading (the A and B periods in TPO terms). It sets the framework for the entire trading session.
Why the Initial Balance Matters
The first hour is when many institutional traders establish their daily positions. The range they create during this period often defines the day's boundaries:
- Narrow IB: Suggests uncertainty. When the IB range is smaller than average, the probability of a range extension (breakout) increases. This is because value has not been established, and a large order or piece of news can push price significantly.
- Wide IB: Suggests conviction. When the IB range is larger than average, price is more likely to spend the rest of the day within that range. The large initial range indicates that value has already been explored.
IB Extension Trading
An IB extension occurs when price breaks out of the Initial Balance range during the trading session. This breakout is significant because it indicates that traders are rejecting the value established in the first hour and seeking new value above or below.
Trading rules:
- Bullish IB extension: Price breaks above the IB high → buy with a target of 1x the IB range above the breakout point
- Bearish IB extension: Price breaks below the IB low → sell/short with a target of 1x the IB range below the breakdown point
Pro Tip
Footprint Charts
Footprint charts (also called order flow charts or cluster charts) are a modern evolution of Market Profile that add granular volume data to each price level, showing the actual number of contracts traded at the bid and ask at every price.
Reading a Footprint Chart
Each cell in a footprint chart shows two numbers:
- Left number: Volume executed at the bid (selling aggression)
- Right number: Volume executed at the ask (buying aggression)
The difference between these numbers is the delta at that price level. A positive delta (more buying at the ask) suggests bullish pressure. A negative delta (more selling at the bid) suggests bearish pressure.
Delta Analysis
Delta is the net difference between buying volume and selling volume at a price level, across a bar, or over a session:
- Positive cumulative delta: More aggressive buying than selling → bullish
- Negative cumulative delta: More aggressive selling than buying → bearish
- Delta divergence: When price makes a new high but cumulative delta is declining, it signals weakening buying conviction — a bearish warning
Imbalances on Footprint Charts
An imbalance is identified when the buying volume at one price significantly exceeds the selling volume at the adjacent price (or vice versa). Common thresholds are 2:1 or 3:1 ratios. These imbalances highlight prices where institutional traders were aggressively filling large orders.
Stacked imbalances (multiple consecutive price levels all showing buying or selling imbalances) indicate extremely aggressive institutional activity and often precede significant directional moves.
Institutional Use of Market Profile
How Institutional Traders Use It
Large institutional traders use Market Profile and footprint data for:
- Identifying value zones: Institutions fill large orders within the value area because there is sufficient liquidity to absorb their size without excessive slippage
- Breakout confirmation: A move outside the value area with strong delta confirms institutional participation in the breakout
- Inventory management: Market makers and dealers use the profile to manage their inventory relative to fair value
- Intraday timing: The IB and POC help institutions time their entries to coincide with favorable auction dynamics
Practical Application for Retail Traders
Retail traders can use Market Profile to:
- Identify key levels before the trading day: Yesterday's POC, VAH, VAL, and any naked POCs are pre-market preparation essentials
- Determine the day type early: Is today's IB narrow (expect breakout) or wide (expect range)? Is the open above, within, or below yesterday's value?
- Trade with institutional flow: Look for single prints and footprint imbalances that reveal institutional direction
- Improve stop placement: Place stops outside the value area rather than at arbitrary price levels — they are more meaningful and harder for the market to trigger incidentally
Market Profile Day Types
Steidlmayer identified several recurring day types that help traders categorize market behavior:
| Day Type | Characteristic | Trading Approach |
|---|---|---|
| Normal Day | Bell-shaped profile, 70%+ time in value area | Range trade within value area |
| Normal Variation | Similar to normal but with one range extension | Trade the extension then fade back to value |
| Trend Day | Elongated profile, POC at one extreme | Trade in trend direction, do not fade |
| Double Distribution | Two separate value areas | Trade the extremes of each distribution |
| Neutral Day | Very balanced, narrow range | Avoid trading or scalp within range |
Trend days are the most important to recognize because fading a trend day (buying dips in a down trend day or selling rallies in an up trend day) is the fastest way to lose money. Trend days are characterized by a lack of back-and-fill — price moves directionally with few retracements.
FAQ
Do I need special software for Market Profile?
Yes. Not all charting platforms support Market Profile. Platforms that offer good Market Profile and footprint chart capabilities include: Sierra Chart (considered the gold standard), NinjaTrader (with add-ons), ATAS (order flow focused), Bookmap (visual order flow), and TradingView (basic TPO/volume profile). The free or low-cost options have limitations, while professional-grade tools like Sierra Chart and ATAS provide the most complete data.
Is Market Profile only for day trading?
No, although it is most commonly used for intraday analysis. Weekly and monthly Market Profiles can be constructed to identify longer-term value areas for swing trading and position trading. However, the concepts of IB, single prints, and TPO analysis are primarily intraday tools.
What is the difference between Market Profile and Volume Profile?
Market Profile (TPO-based) measures time spent at each price level — how many 30-minute periods traded there. Volume Profile measures actual volume traded at each price level. Both create similar-looking distributions, but they can diverge when high-volume bursts occur in short periods (high volume, few TPOs). Many modern traders use Volume Profile as a more direct measure of participation, while traditional Market Profile purists prefer TPOs.
How do I identify a trend day using Market Profile?
A trend day typically shows: (1) a narrow Initial Balance that gets broken early, (2) the POC at or near one extreme of the profile (not in the middle), (3) single prints throughout (few revisits of previously traded levels), and (4) progressive widening of the profile in one direction. When you see these characteristics developing in the first 1-2 hours, recognize it as a trend day and trade with the direction rather than fading moves.
Can Market Profile be used for cryptocurrency or forex?
Yes. Market Profile concepts apply to any auction market. For 24-hour markets like crypto and forex, you need to define what constitutes a "session" (since there is no official open/close). Many forex traders use the London session open, the New York session open, or the Asian session open as their reference points for building daily profiles.
Disclaimer
This is educational content, not financial advice. Trading involves risk, and you should consult a qualified financial advisor before making any investment decisions. Past performance does not guarantee future results.
Related Articles
12 chapters covering charts, indicators, risk management & more. Plus weekly trading insights.